| Param | Original file | Final file |
|---|---|---|
| Filename | modeM0/AS1C05_019T01_9000004332cztM0_level2_bc.evt | modeM0/AS1C05_019T01_9000004332cztM0_level2_quad_clean.evt |
| Size (bytes) | 3,774,556,800 | 1,640,410,560 |
| Size | 3.5 GB | 1.5 GB |
| Events in quadrant A | 18,218,639 | 11,255,057 |
| Events in quadrant B | 42,143,277 | 11,234,491 |
| Events in quadrant C | 18,355,235 | 10,762,293 |
| Events in quadrant D | 29,789,916 | 10,586,614 |
| Mode M9 | |||
|---|---|---|---|
| Quadrant | BADHDUFLAG | Total packets | Discarded packets |
| A | 0 | 123 | 0 |
| B | 0 | 123 | 0 |
| C | 0 | 123 | 0 |
| D | 0 | 123 | 0 |
| Mode M0 | |||
|---|---|---|---|
| Quadrant | BADHDUFLAG | Total packets | Discarded packets |
| A | 0 | 176640 | 0 |
| B | 0 | 259382 | 0 |
| C | 0 | 180001 | 0 |
| D | 0 | 213010 | 0 |
| Mode SS | |||
|---|---|---|---|
| Quadrant | BADHDUFLAG | Total packets | Discarded packets |
| A | 0 | 1738 | 0 |
| B | 0 | 1738 | 0 |
| C | 0 | 1738 | 0 |
| D | 0 | 1738 | 0 |
| Quadrant | Total seconds | Saturated seconds | Saturation percentage |
|---|---|---|---|
| A | 85400 | 888 | 1.039813% |
| B | 85400 | 1893 | 2.216628% |
| C | 85400 | 2323 | 2.720141% |
| D | 85400 | 2552 | 2.988290% |
Noise dominated data is calculated using 1-second bins in cleaned event files. If a bin has >2000 counts, and if more than 50% of those come from <1% of pixels, then it is considered to be noise-dominated and hence unusable.
| Quadrant | # 1 sec bins | Bins with >0 counts | Bins with >2000 counts | High rate bins dominated by noise | Noise dominated (total time) | Noise dominated (detector-on time) | Marked lightcurve |
|---|---|---|---|---|---|---|---|
| A | 97510 | 85401 | 6 | 6 | 0.01% | 0.01% |  |
| B | 97510 | 85401 | 13 | 13 | 0.01% | 0.02% |  |
| C | 97510 | 85399 | 16 | 16 | 0.02% | 0.02% |  |
| D | 97510 | 85402 | 363 | 363 | 0.37% | 0.43% |  |
Top three noisy pixels from each quadrant. If the there are fewer than three noisy pixels in the level2.evt file, extra rows are filled as -1
| Pixel properties | Quadrant properties | ||||||
|---|---|---|---|---|---|---|---|
| Quadrant | DetID | PixID | Counts | Sigma | Mean | Median | Sigma |
| A | 0 | 13 | 410069 | 414.01 | 4520 | 4460 | 979.7 |
| A | 8 | 192 | 172038 | 171.05 | 4520 | 4460 | 979.7 |
| A | 14 | 238 | 163209 | 162.04 | 4520 | 4460 | 979.7 |
| B | 6 | 159 | 23641932 | 27471.19 | 4524 | 4427 | 860.4 |
| B | 0 | 190 | 492377 | 567.09 | 4524 | 4427 | 860.4 |
| B | 4 | 171 | 364557 | 418.54 | 4524 | 4427 | 860.4 |
| C | 3 | 233 | 1297770 | 1280.52 | 4292 | 4290 | 1010.1 |
| C | 14 | 254 | 197130 | 190.91 | 4292 | 4290 | 1010.1 |
| C | 2 | 114 | 160557 | 154.7 | 4292 | 4290 | 1010.1 |
| D | 1 | 52 | 5601874 | 5517.29 | 4335 | 4229 | 1014.6 |
| D | 8 | 195 | 2498961 | 2458.92 | 4335 | 4229 | 1014.6 |
| D | 13 | 104 | 1274556 | 1252.09 | 4335 | 4229 | 1014.6 |
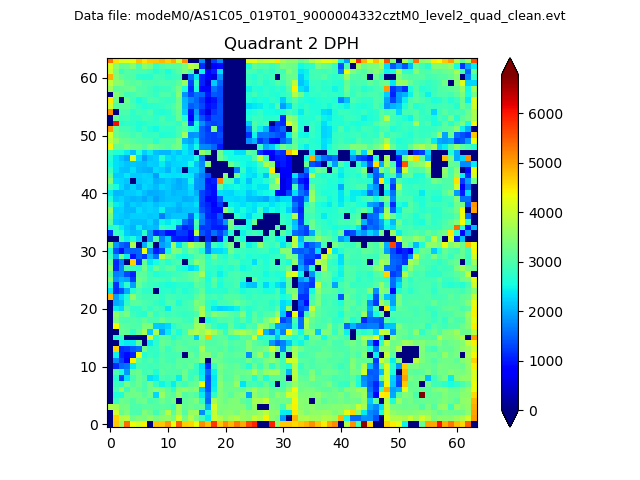
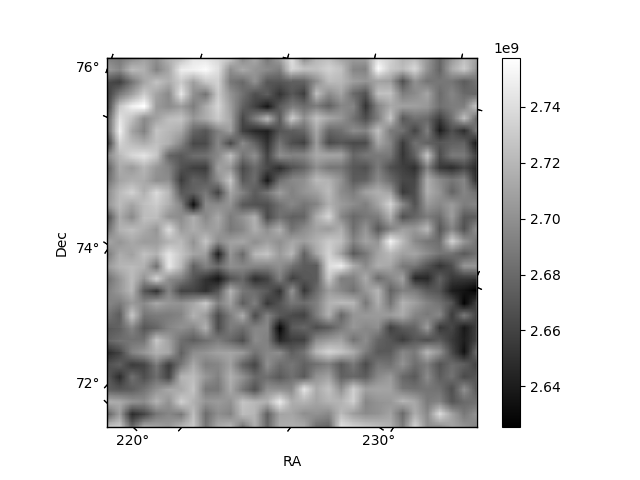
Histogram calculated using DETX and DETY for each event in the final _common_clean file
| Quadrant A | 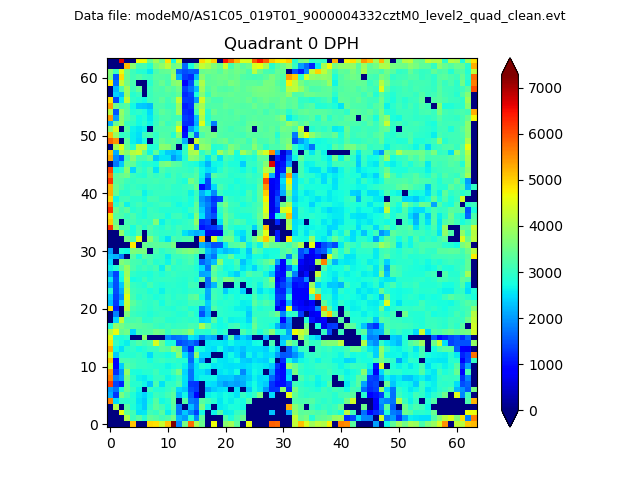 |
 |
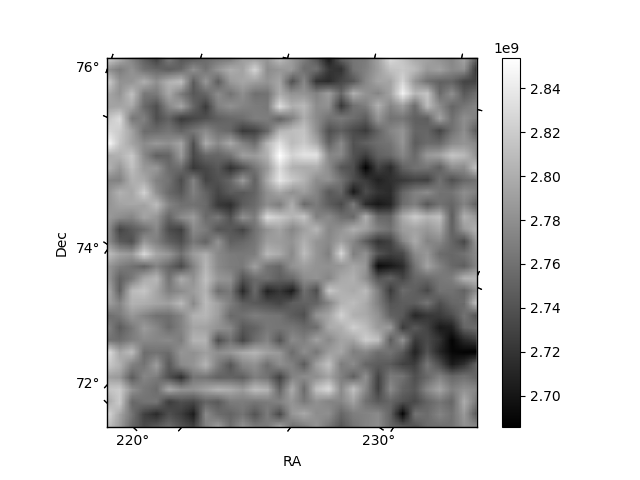
Quadrant B |
|---|---|---|---|
| Quadrant D |  |
 |
Quadrant C |
| Plot type | Count rate plots | Images |
|---|---|---|
| Comparison with Poisson distribution Blue bars denote a histogram of data divided into 1 sec bins. Red curve is a Poisson curve with rate = median count rate of data. |
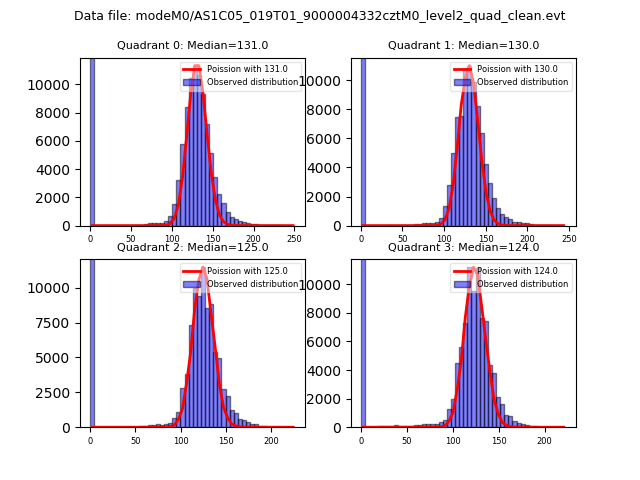 |
 |
| Quadrant-wise count rates Data is divided into 100 sec bins |
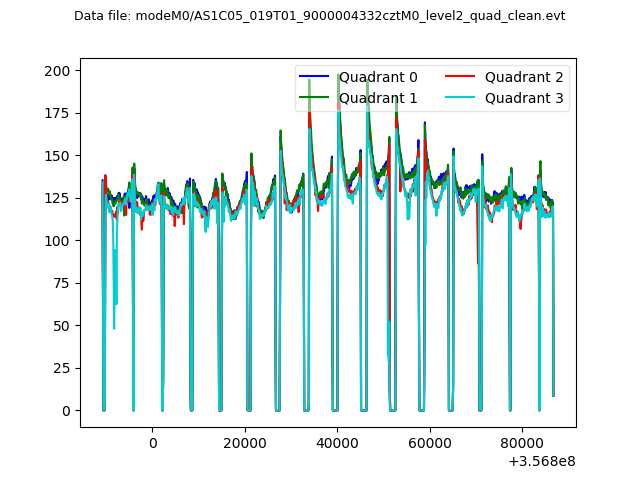 |
|
| Module-wise count rates for Quadrant A Data is divided into 100 sec bins |
 |
 |
| Module-wise count rates for Quadrant B Data is divided into 100 sec bins |
 |
 |
| Module-wise count rates for Quadrant C Data is divided into 100 sec bins |
 |
 |
| Module-wise count rates for Quadrant D Data is divided into 100 sec bins |
 |
 |
| Parameter | Plot |
|---|---|
| CZT HV Monitor |  |
| D_VDD |  |
| Temperature 1 |  |
| Veto HV Monitor |  |
| Veto LLD |  |
| Alpha Counter |  |
| _CPM_Rate | 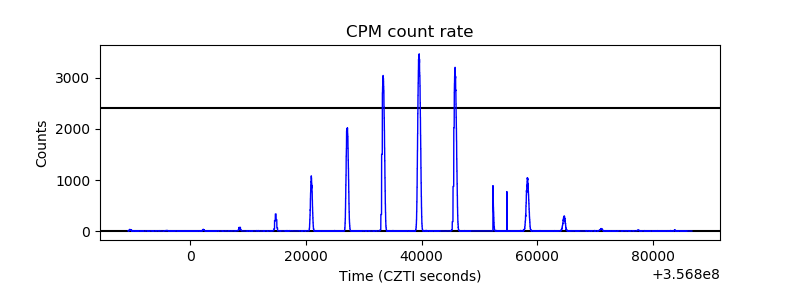 |
| CZT Counter |  |
| +2.5 Volts monitor | 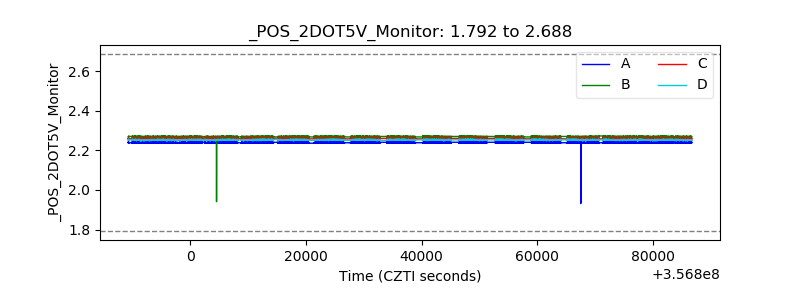 |
| +5 Volts monitor |  |
| _ROLL_ROT |  |
| _Roll_DEC |  |
| _Roll_RA | 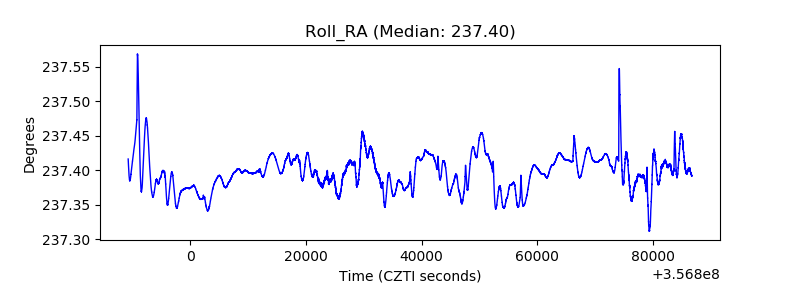 |
| Veto Counter | 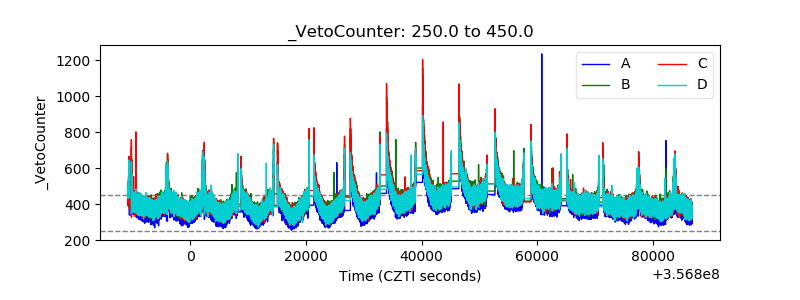 |