| Param | Original file | Final file |
|---|---|---|
| Filename | modeM0/AS1A10_071T10_9000004328cztM0_level2_bc.evt | modeM0/AS1A10_071T10_9000004328cztM0_level2_quad_clean.evt |
| Size (bytes) | 2,324,972,160 | 667,200,960 |
| Size | 2.2 GB | 636.3 MB |
| Events in quadrant A | 11,309,012 | 4,338,625 |
| Events in quadrant B | 25,209,251 | 4,340,602 |
| Events in quadrant C | 11,715,330 | 4,120,979 |
| Events in quadrant D | 18,692,151 | 3,893,597 |
| Mode M0 | |||
|---|---|---|---|
| Quadrant | BADHDUFLAG | Total packets | Discarded packets |
| A | 0 | 107255 | 0 |
| B | 0 | 156738 | 0 |
| C | 0 | 111027 | 0 |
| D | 0 | 133695 | 0 |
| Mode SS | |||
|---|---|---|---|
| Quadrant | BADHDUFLAG | Total packets | Discarded packets |
| A | 0 | 1046 | 0 |
| B | 0 | 1046 | 0 |
| C | 0 | 1046 | 0 |
| D | 0 | 1046 | 0 |
| Mode M9 | |||
|---|---|---|---|
| Quadrant | BADHDUFLAG | Total packets | Discarded packets |
| A | 0 | 86 | 0 |
| B | 0 | 86 | 0 |
| C | 0 | 86 | 0 |
| D | 0 | 86 | 0 |
| Quadrant | Total seconds | Saturated seconds | Saturation percentage |
|---|---|---|---|
| A | 51210 | 794 | 1.550478% |
| B | 51210 | 1421 | 2.774849% |
| C | 51210 | 1178 | 2.300332% |
| D | 51210 | 3459 | 6.754540% |
Noise dominated data is calculated using 1-second bins in cleaned event files. If a bin has >2000 counts, and if more than 50% of those come from <1% of pixels, then it is considered to be noise-dominated and hence unusable.
| Quadrant | # 1 sec bins | Bins with >0 counts | Bins with >2000 counts | High rate bins dominated by noise | Noise dominated (total time) | Noise dominated (detector-on time) | Marked lightcurve |
|---|---|---|---|---|---|---|---|
| A | 59906 | 51213 | 0 | 0 | 0.00% | 0.00% |  |
| B | 59906 | 51214 | 12 | 12 | 0.02% | 0.02% |  |
| C | 59906 | 51213 | 5 | 5 | 0.01% | 0.01% |  |
| D | 59906 | 51208 | 260 | 260 | 0.43% | 0.51% |  |
Top three noisy pixels from each quadrant. If the there are fewer than three noisy pixels in the level2.evt file, extra rows are filled as -1
| Pixel properties | Quadrant properties | ||||||
|---|---|---|---|---|---|---|---|
| Quadrant | DetID | PixID | Counts | Sigma | Mean | Median | Sigma |
| A | 8 | 192 | 112804 | 178.63 | 2901 | 2853 | 615.5 |
| A | 13 | 254 | 86363 | 135.68 | 2901 | 2853 | 615.5 |
| A | 0 | 226 | 18335 | 25.15 | 2901 | 2853 | 615.5 |
| B | 6 | 159 | 13512037 | 24609.5 | 2914 | 2849 | 548.9 |
| B | 0 | 229 | 389985 | 705.24 | 2914 | 2849 | 548.9 |
| B | 4 | 171 | 87140 | 153.55 | 2914 | 2849 | 548.9 |
| C | 3 | 233 | 928812 | 1452.09 | 2749 | 2745 | 637.7 |
| C | 2 | 114 | 96629 | 147.21 | 2749 | 2745 | 637.7 |
| C | 10 | 22 | 69333 | 104.41 | 2749 | 2745 | 637.7 |
| D | 13 | 104 | 5828428 | 9375.59 | 2720 | 2653 | 621.4 |
| D | 8 | 195 | 1106239 | 1776.03 | 2720 | 2653 | 621.4 |
| D | 7 | 223 | 461254 | 738.04 | 2720 | 2653 | 621.4 |
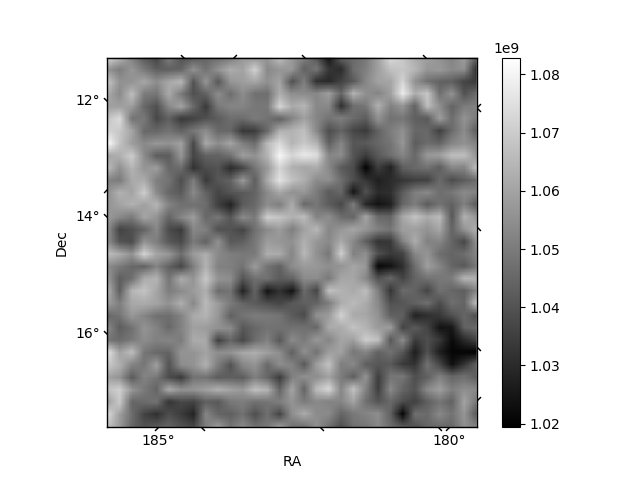
Histogram calculated using DETX and DETY for each event in the final _common_clean file
| Quadrant A |  |
 |
Quadrant B |
|---|---|---|---|
| Quadrant D |  |
 |
Quadrant C |
| Plot type | Count rate plots | Images |
|---|---|---|
| Comparison with Poisson distribution Blue bars denote a histogram of data divided into 1 sec bins. Red curve is a Poisson curve with rate = median count rate of data. |
 |
 |
| Quadrant-wise count rates Data is divided into 100 sec bins |
 |
|
| Module-wise count rates for Quadrant A Data is divided into 100 sec bins |
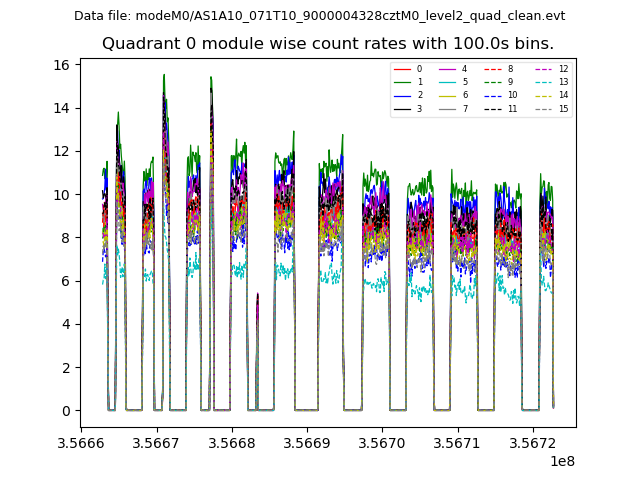 |
 |
| Module-wise count rates for Quadrant B Data is divided into 100 sec bins |
 |
 |
| Module-wise count rates for Quadrant C Data is divided into 100 sec bins |
 |
 |
| Module-wise count rates for Quadrant D Data is divided into 100 sec bins |
 |
 |
| Parameter | Plot |
|---|---|
| CZT HV Monitor |  |
| D_VDD |  |
| Temperature 1 | 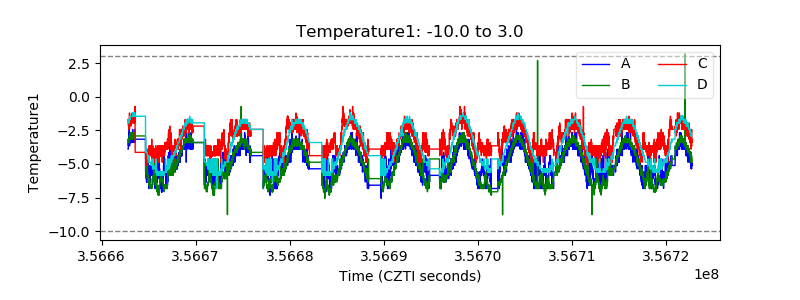 |
| Veto HV Monitor |  |
| Veto LLD |  |
| Alpha Counter | 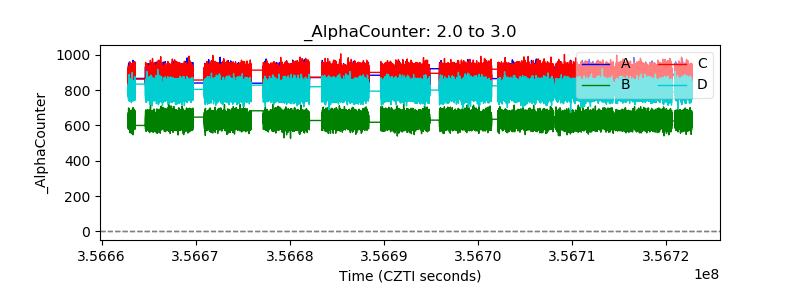 |
| _CPM_Rate |  |
| CZT Counter | 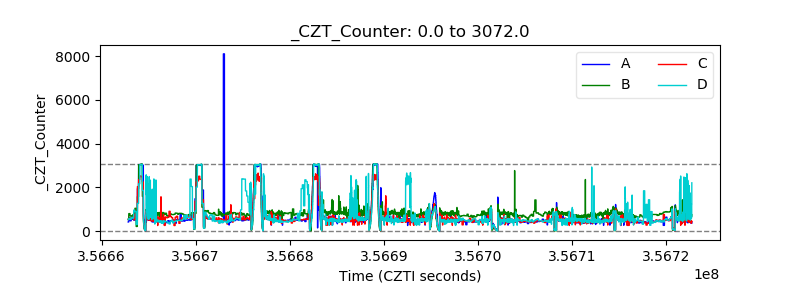 |
| +2.5 Volts monitor |  |
| +5 Volts monitor |  |
| _ROLL_ROT |  |
| _Roll_DEC |  |
| _Roll_RA | 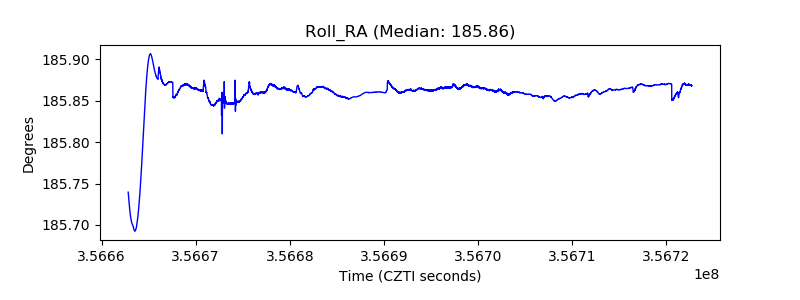 |
| Veto Counter |  |