| Param | Original file | Final file |
|---|---|---|
| Filename | modeM0/AS1A10_050T05_9000004330cztM0_level2_bc.evt | modeM0/AS1A10_050T05_9000004330cztM0_level2_quad_clean.evt |
| Size (bytes) | 2,460,700,800 | 733,224,960 |
| Size | 2.3 GB | 699.3 MB |
| Events in quadrant A | 12,335,067 | 4,742,102 |
| Events in quadrant B | 29,469,540 | 4,704,142 |
| Events in quadrant C | 11,466,767 | 4,588,091 |
| Events in quadrant D | 17,606,516 | 4,499,061 |
| Mode SS | |||
|---|---|---|---|
| Quadrant | BADHDUFLAG | Total packets | Discarded packets |
| A | 0 | 1094 | 0 |
| B | 0 | 1094 | 0 |
| C | 0 | 1094 | 0 |
| D | 0 | 1094 | 0 |
| Mode M9 | |||
|---|---|---|---|
| Quadrant | BADHDUFLAG | Total packets | Discarded packets |
| A | 0 | 103 | 0 |
| B | 0 | 103 | 0 |
| C | 0 | 103 | 0 |
| D | 0 | 103 | 0 |
| Mode M0 | |||
|---|---|---|---|
| Quadrant | BADHDUFLAG | Total packets | Discarded packets |
| A | 0 | 113707 | 0 |
| B | 0 | 171586 | 0 |
| C | 0 | 113299 | 0 |
| D | 0 | 131169 | 0 |
| Quadrant | Total seconds | Saturated seconds | Saturation percentage |
|---|---|---|---|
| A | 53568 | 488 | 0.910992% |
| B | 53568 | 1772 | 3.307945% |
| C | 53568 | 1016 | 1.896655% |
| D | 53568 | 1928 | 3.599164% |
Noise dominated data is calculated using 1-second bins in cleaned event files. If a bin has >2000 counts, and if more than 50% of those come from <1% of pixels, then it is considered to be noise-dominated and hence unusable.
| Quadrant | # 1 sec bins | Bins with >0 counts | Bins with >2000 counts | High rate bins dominated by noise | Noise dominated (total time) | Noise dominated (detector-on time) | Marked lightcurve |
|---|---|---|---|---|---|---|---|
| A | 63933 | 53571 | 14 | 14 | 0.02% | 0.03% |  |
| B | 63933 | 53568 | 211 | 211 | 0.33% | 0.39% |  |
| C | 63933 | 53567 | 0 | 0 | 0.00% | 0.00% |  |
| D | 63933 | 53569 | 321 | 321 | 0.50% | 0.60% |  |
Top three noisy pixels from each quadrant. If the there are fewer than three noisy pixels in the level2.evt file, extra rows are filled as -1
| Pixel properties | Quadrant properties | ||||||
|---|---|---|---|---|---|---|---|
| Quadrant | DetID | PixID | Counts | Sigma | Mean | Median | Sigma |
| A | 0 | 13 | 675656 | 1053.59 | 2989 | 2941 | 638.5 |
| A | 8 | 192 | 113768 | 173.57 | 2989 | 2941 | 638.5 |
| A | 13 | 254 | 94759 | 143.8 | 2989 | 2941 | 638.5 |
| B | 6 | 159 | 14945945 | 26776.99 | 2970 | 2902 | 558.1 |
| B | 0 | 229 | 2304869 | 4124.98 | 2970 | 2902 | 558.1 |
| B | 0 | 190 | 491282 | 875.15 | 2970 | 2902 | 558.1 |
| C | 3 | 233 | 160127 | 234.05 | 2875 | 2873 | 671.9 |
| C | 2 | 114 | 103183 | 149.3 | 2875 | 2873 | 671.9 |
| C | 14 | 254 | 97752 | 141.22 | 2875 | 2873 | 671.9 |
| D | 13 | 104 | 2626564 | 3883.55 | 2904 | 2832 | 675.6 |
| D | 8 | 195 | 1193210 | 1761.95 | 2904 | 2832 | 675.6 |
| D | 7 | 238 | 502914 | 740.2 | 2904 | 2832 | 675.6 |
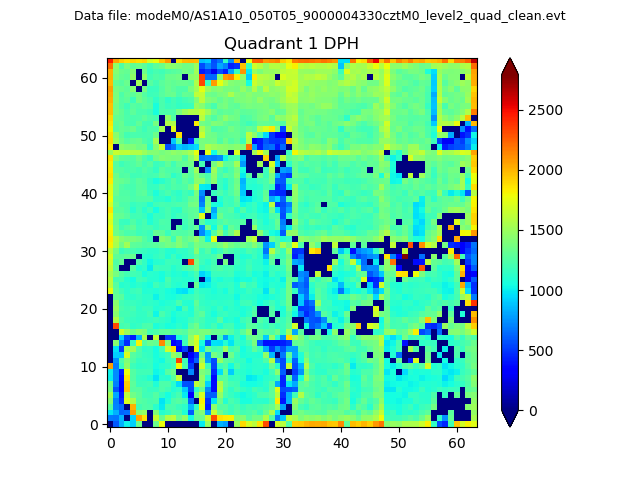
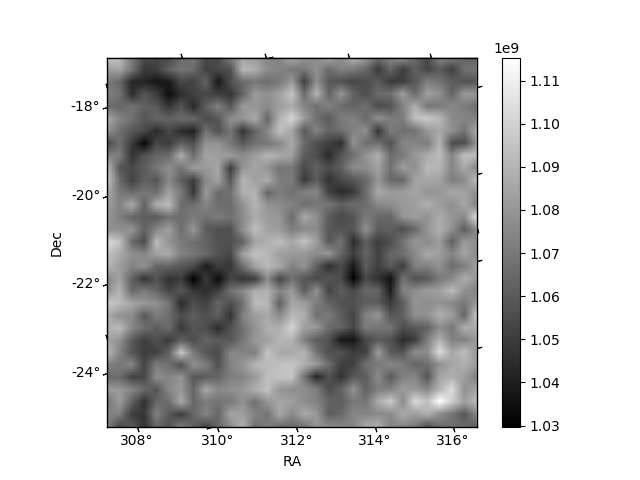
Histogram calculated using DETX and DETY for each event in the final _common_clean file
| Quadrant A |  |
 |
Quadrant B |
|---|---|---|---|
| Quadrant D | 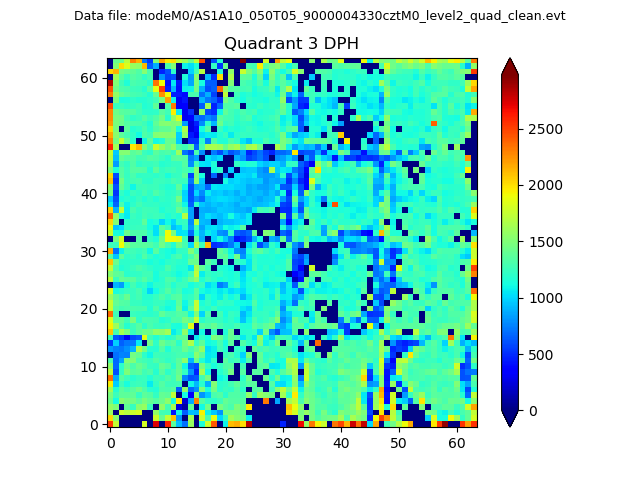 |
 |
Quadrant C |
| Plot type | Count rate plots | Images |
|---|---|---|
| Comparison with Poisson distribution Blue bars denote a histogram of data divided into 1 sec bins. Red curve is a Poisson curve with rate = median count rate of data. |
 |
 |
| Quadrant-wise count rates Data is divided into 100 sec bins |
 |
|
| Module-wise count rates for Quadrant A Data is divided into 100 sec bins |
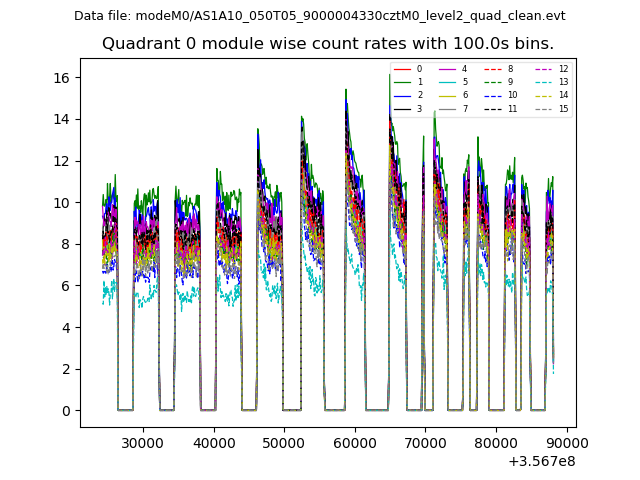 |
 |
| Module-wise count rates for Quadrant B Data is divided into 100 sec bins |
 |
 |
| Module-wise count rates for Quadrant C Data is divided into 100 sec bins |
 |
 |
| Module-wise count rates for Quadrant D Data is divided into 100 sec bins |
 |
 |
| Parameter | Plot |
|---|---|
| CZT HV Monitor |  |
| D_VDD | 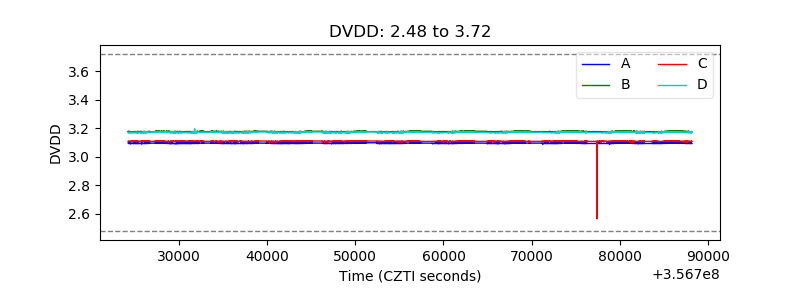 |
| Temperature 1 |  |
| Veto HV Monitor |  |
| Veto LLD |  |
| Alpha Counter |  |
| _CPM_Rate |  |
| CZT Counter |  |
| +2.5 Volts monitor |  |
| +5 Volts monitor | 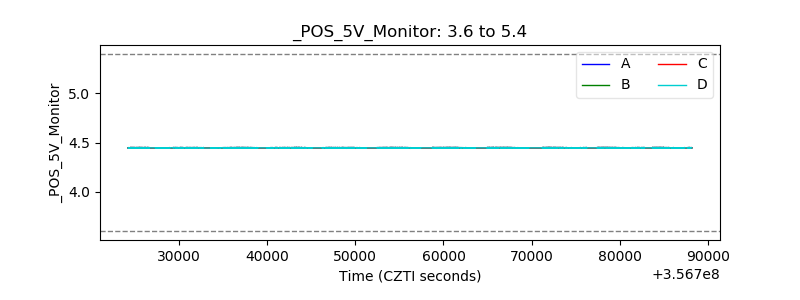 |
| _ROLL_ROT |  |
| _Roll_DEC |  |
| _Roll_RA |  |
| Veto Counter |  |