| Param | Original file | Final file |
|---|---|---|
| Filename | modeM0/AS1A10_071T08_9000004326cztM0_level2_bc.evt | modeM0/AS1A10_071T08_9000004326cztM0_level2_quad_clean.evt |
| Size (bytes) | 321,073,920 | 75,153,600 |
| Size | 306.2 MB | 71.7 MB |
| Events in quadrant A | 1,574,552 | 446,335 |
| Events in quadrant B | 3,769,272 | 445,648 |
| Events in quadrant C | 1,663,714 | 425,562 |
| Events in quadrant D | 2,179,167 | 416,573 |
| Mode M9 | |||
|---|---|---|---|
| Quadrant | BADHDUFLAG | Total packets | Discarded packets |
| A | 0 | 10 | 0 |
| B | 0 | 10 | 0 |
| C | 0 | 10 | 0 |
| D | 0 | 10 | 0 |
| Mode SS | |||
|---|---|---|---|
| Quadrant | BADHDUFLAG | Total packets | Discarded packets |
| A | 0 | 158 | 0 |
| B | 0 | 158 | 0 |
| C | 0 | 158 | 0 |
| D | 0 | 158 | 0 |
| Mode M0 | |||
|---|---|---|---|
| Quadrant | BADHDUFLAG | Total packets | Discarded packets |
| A | 0 | 15861 | 0 |
| B | 0 | 23350 | 0 |
| C | 0 | 16166 | 0 |
| D | 0 | 17728 | 0 |
| Quadrant | Total seconds | Saturated seconds | Saturation percentage |
|---|---|---|---|
| A | 7784 | 38 | 0.488181% |
| B | 7784 | 81 | 1.040596% |
| C | 7784 | 77 | 0.989209% |
| D | 7784 | 102 | 1.310380% |
Noise dominated data is calculated using 1-second bins in cleaned event files. If a bin has >2000 counts, and if more than 50% of those come from <1% of pixels, then it is considered to be noise-dominated and hence unusable.
| Quadrant | # 1 sec bins | Bins with >0 counts | Bins with >2000 counts | High rate bins dominated by noise | Noise dominated (total time) | Noise dominated (detector-on time) | Marked lightcurve |
|---|---|---|---|---|---|---|---|
| A | 8754 | 7784 | 0 | 0 | 0.00% | 0.00% |  |
| B | 8754 | 7785 | 0 | 0 | 0.00% | 0.00% |  |
| C | 8754 | 7784 | 0 | 0 | 0.00% | 0.00% |  |
| D | 8754 | 7784 | 23 | 23 | 0.26% | 0.30% |  |
Top three noisy pixels from each quadrant. If the there are fewer than three noisy pixels in the level2.evt file, extra rows are filled as -1
| Pixel properties | Quadrant properties | ||||||
|---|---|---|---|---|---|---|---|
| Quadrant | DetID | PixID | Counts | Sigma | Mean | Median | Sigma |
| A | 8 | 192 | 14652 | 160.44 | 402 | 393 | 88.9 |
| A | 13 | 254 | 13288 | 145.09 | 402 | 393 | 88.9 |
| A | 3 | 1 | 6735 | 71.36 | 402 | 393 | 88.9 |
| B | 6 | 159 | 2213580 | 28358.83 | 403 | 394 | 78.0 |
| B | 4 | 171 | 5531 | 65.82 | 403 | 394 | 78.0 |
| B | 4 | 187 | 3899 | 44.91 | 403 | 394 | 78.0 |
| C | 3 | 233 | 156687 | 1690.9 | 384 | 381 | 92.4 |
| C | 2 | 114 | 14667 | 154.54 | 384 | 381 | 92.4 |
| C | 10 | 22 | 5870 | 59.38 | 384 | 381 | 92.4 |
| D | 13 | 104 | 376102 | 4153.48 | 388 | 377 | 90.5 |
| D | 13 | 168 | 136771 | 1507.78 | 388 | 377 | 90.5 |
| D | 8 | 195 | 116375 | 1282.31 | 388 | 377 | 90.5 |
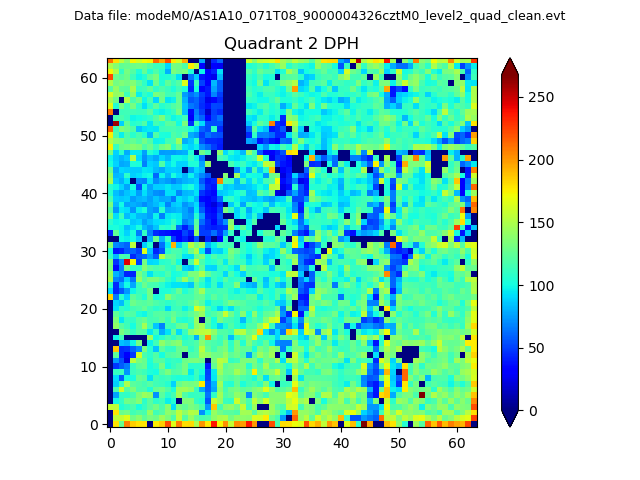
Histogram calculated using DETX and DETY for each event in the final _common_clean file
| Quadrant A | 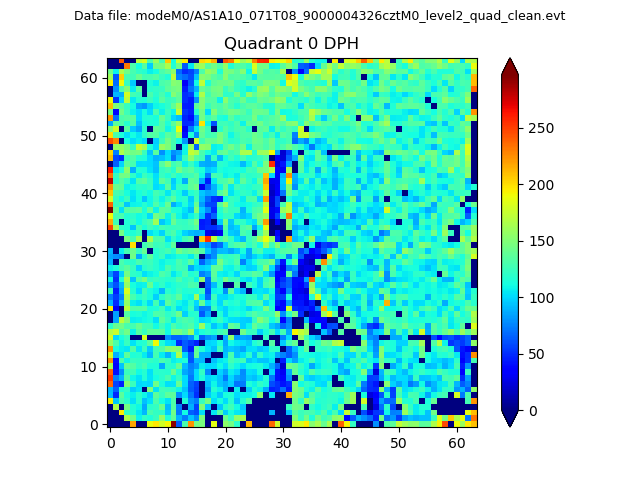 |
 |
Quadrant B |
|---|---|---|---|
| Quadrant D |  |
 |
Quadrant C |
| Plot type | Count rate plots | Images |
|---|---|---|
| Comparison with Poisson distribution Blue bars denote a histogram of data divided into 1 sec bins. Red curve is a Poisson curve with rate = median count rate of data. |
 |
 |
| Quadrant-wise count rates Data is divided into 100 sec bins |
 |
|
| Module-wise count rates for Quadrant A Data is divided into 100 sec bins |
 |
 |
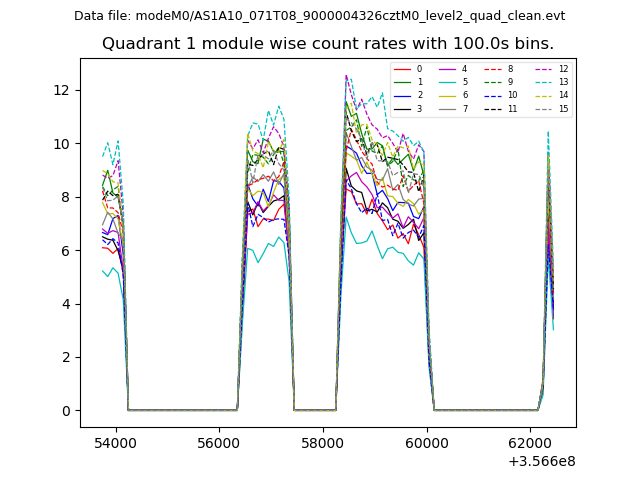
| Module-wise count rates for Quadrant B Data is divided into 100 sec bins |
 |
 |
| Module-wise count rates for Quadrant C Data is divided into 100 sec bins |
 |
 |
| Module-wise count rates for Quadrant D Data is divided into 100 sec bins |
 |
 |
| Parameter | Plot |
|---|---|
| CZT HV Monitor |  |
| D_VDD |  |
| Temperature 1 |  |
| Veto HV Monitor |  |
| Veto LLD |  |
| Alpha Counter | 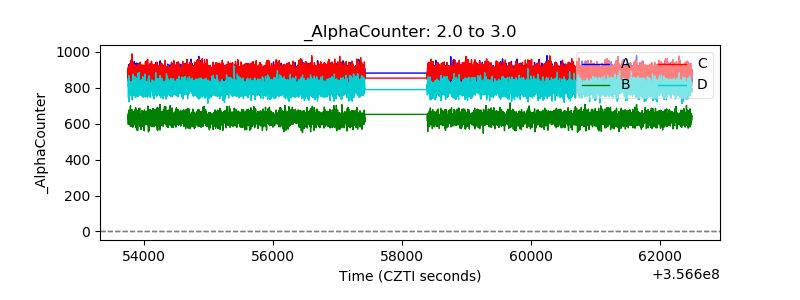 |
| _CPM_Rate |  |
| CZT Counter | 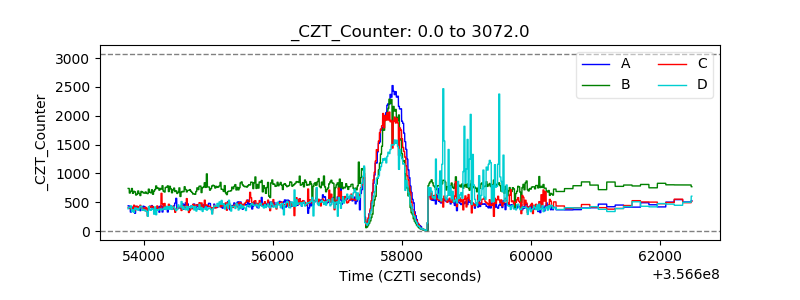 |
| +2.5 Volts monitor |  |
| +5 Volts monitor |  |
| _ROLL_ROT |  |
| _Roll_DEC |  |
| _Roll_RA |  |
| Veto Counter | 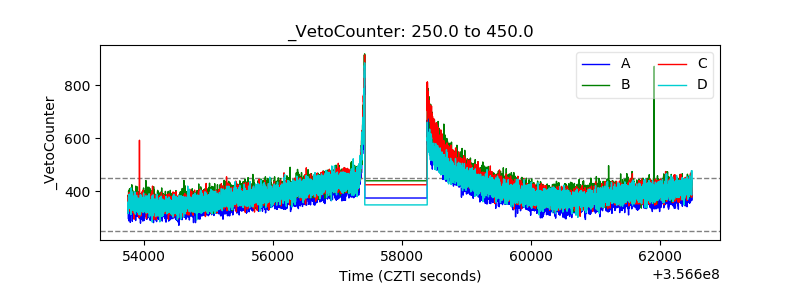 |