| Param | Original file | Final file |
|---|---|---|
| Filename | modeM0/AS1A10_071T06_9000004324cztM0_level2_bc.evt | modeM0/AS1A10_071T06_9000004324cztM0_level2_quad_clean.evt |
| Size (bytes) | 1,591,309,440 | 477,996,480 |
| Size | 1.5 GB | 455.9 MB |
| Events in quadrant A | 7,774,702 | 3,092,211 |
| Events in quadrant B | 17,992,360 | 3,071,548 |
| Events in quadrant C | 7,767,253 | 2,946,491 |
| Events in quadrant D | 12,069,116 | 2,759,592 |
| Mode SS | |||
|---|---|---|---|
| Quadrant | BADHDUFLAG | Total packets | Discarded packets |
| A | 0 | 772 | 0 |
| B | 0 | 772 | 0 |
| C | 0 | 772 | 0 |
| D | 0 | 772 | 0 |
| Mode M0 | |||
|---|---|---|---|
| Quadrant | BADHDUFLAG | Total packets | Discarded packets |
| A | 0 | 78986 | 0 |
| B | 0 | 115156 | 0 |
| C | 0 | 79716 | 0 |
| D | 0 | 98115 | 0 |
| Mode M9 | |||
|---|---|---|---|
| Quadrant | BADHDUFLAG | Total packets | Discarded packets |
| A | 0 | 36 | 0 |
| B | 0 | 36 | 0 |
| C | 0 | 36 | 0 |
| D | 0 | 36 | 0 |
| Quadrant | Total seconds | Saturated seconds | Saturation percentage |
|---|---|---|---|
| A | 37971 | 774 | 2.038398% |
| B | 37971 | 1279 | 3.368360% |
| C | 37971 | 1099 | 2.894314% |
| D | 37971 | 2799 | 7.371415% |
Noise dominated data is calculated using 1-second bins in cleaned event files. If a bin has >2000 counts, and if more than 50% of those come from <1% of pixels, then it is considered to be noise-dominated and hence unusable.
| Quadrant | # 1 sec bins | Bins with >0 counts | Bins with >2000 counts | High rate bins dominated by noise | Noise dominated (total time) | Noise dominated (detector-on time) | Marked lightcurve |
|---|---|---|---|---|---|---|---|
| A | 41531 | 37974 | 0 | 0 | 0.00% | 0.00% |  |
| B | 41531 | 37973 | 8 | 8 | 0.02% | 0.02% |  |
| C | 41531 | 37974 | 1 | 1 | 0.00% | 0.00% |  |
| D | 41531 | 37964 | 200 | 200 | 0.48% | 0.53% |  |
Top three noisy pixels from each quadrant. If the there are fewer than three noisy pixels in the level2.evt file, extra rows are filled as -1
| Pixel properties | Quadrant properties | ||||||
|---|---|---|---|---|---|---|---|
| Quadrant | DetID | PixID | Counts | Sigma | Mean | Median | Sigma |
| A | 8 | 192 | 71667 | 161.98 | 1984 | 1947 | 430.4 |
| A | 13 | 254 | 60582 | 136.23 | 1984 | 1947 | 430.4 |
| A | 3 | 1 | 24011 | 51.26 | 1984 | 1947 | 430.4 |
| B | 6 | 159 | 10252102 | 26780.68 | 1980 | 1926 | 382.7 |
| B | 0 | 229 | 86550 | 221.1 | 1980 | 1926 | 382.7 |
| B | 4 | 171 | 33741 | 83.12 | 1980 | 1926 | 382.7 |
| C | 3 | 233 | 297687 | 660.56 | 1893 | 1880 | 447.8 |
| C | 2 | 114 | 72890 | 158.57 | 1893 | 1880 | 447.8 |
| C | 10 | 20 | 52830 | 113.78 | 1893 | 1880 | 447.8 |
| D | 13 | 104 | 3428409 | 7951.46 | 1863 | 1808 | 430.9 |
| D | 8 | 195 | 736263 | 1704.31 | 1863 | 1808 | 430.9 |
| D | 2 | 250 | 186780 | 429.23 | 1863 | 1808 | 430.9 |
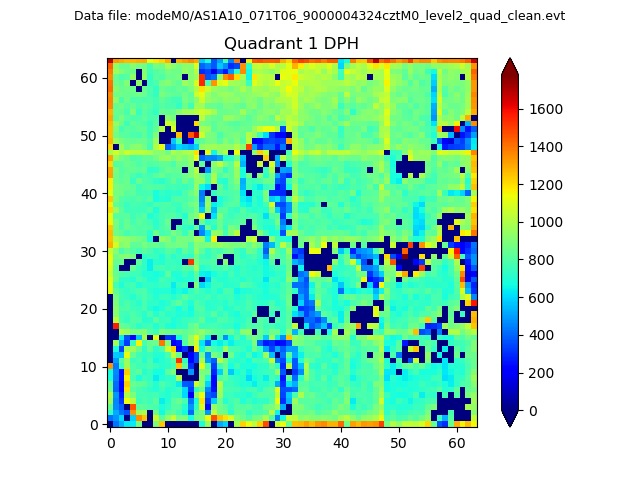
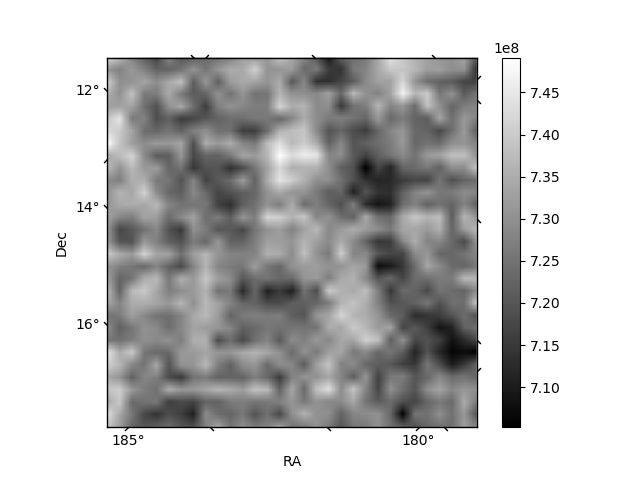
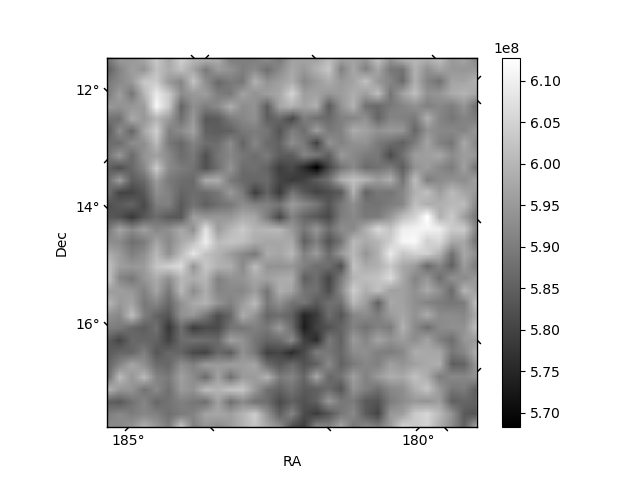
Histogram calculated using DETX and DETY for each event in the final _common_clean file
| Quadrant A |  |
 |
Quadrant B |
|---|---|---|---|
| Quadrant D | 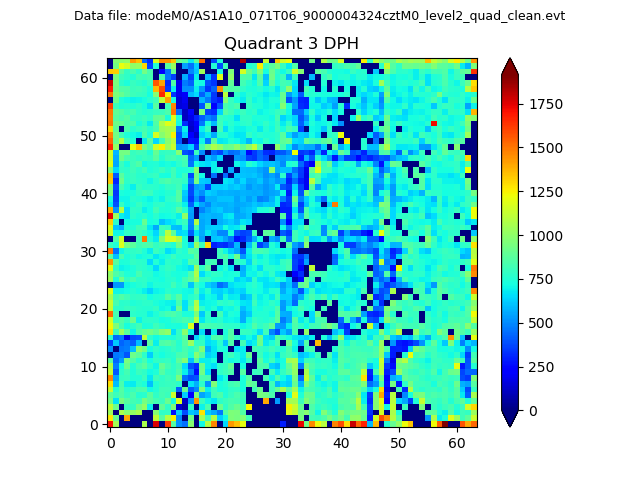 |
 |
Quadrant C |
| Plot type | Count rate plots | Images |
|---|---|---|
| Comparison with Poisson distribution Blue bars denote a histogram of data divided into 1 sec bins. Red curve is a Poisson curve with rate = median count rate of data. |
 |
 |
| Quadrant-wise count rates Data is divided into 100 sec bins |
 |
|
| Module-wise count rates for Quadrant A Data is divided into 100 sec bins |
 |
 |
| Module-wise count rates for Quadrant B Data is divided into 100 sec bins |
 |
 |
| Module-wise count rates for Quadrant C Data is divided into 100 sec bins |
 |
 |
| Module-wise count rates for Quadrant D Data is divided into 100 sec bins |
 |
 |
| Parameter | Plot |
|---|---|
| CZT HV Monitor |  |
| D_VDD |  |
| Temperature 1 |  |
| Veto HV Monitor | 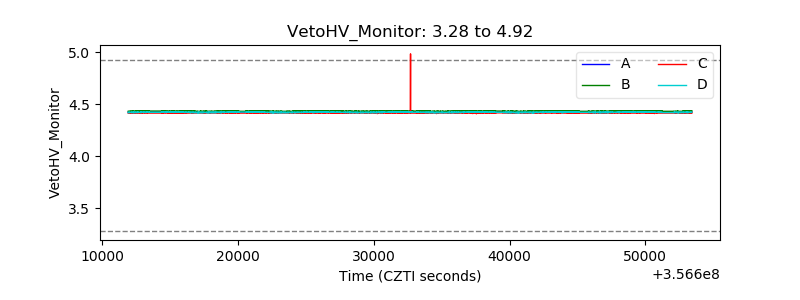 |
| Veto LLD | 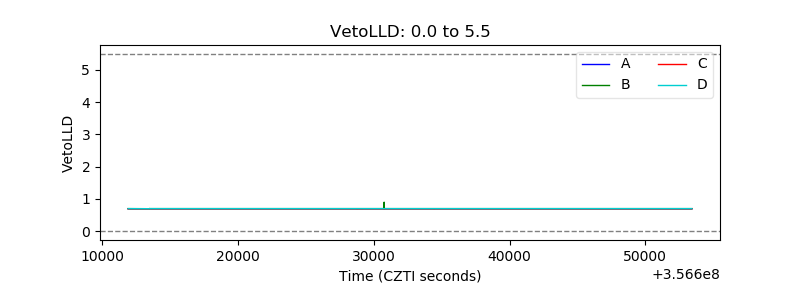 |
| Alpha Counter |  |
| _CPM_Rate |  |
| CZT Counter | 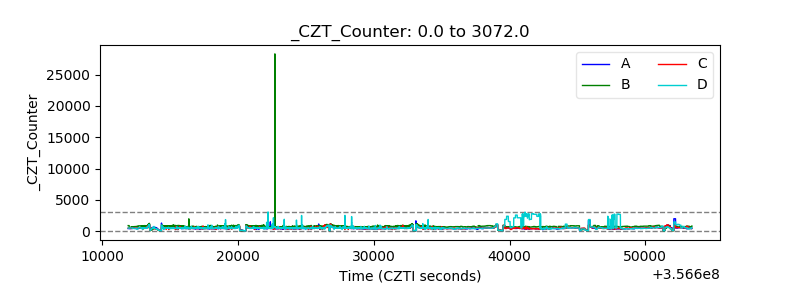 |
| +2.5 Volts monitor |  |
| +5 Volts monitor |  |
| _ROLL_ROT |  |
| _Roll_DEC | 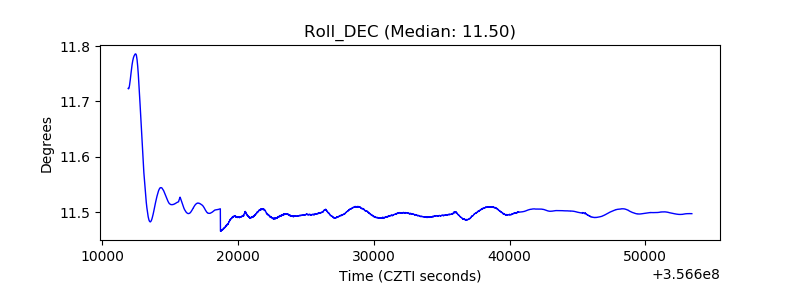 |
| _Roll_RA |  |
| Veto Counter |  |