| Param | Original file | Final file |
|---|---|---|
| Filename | modeM0/AS1A10_071T07_9000004322cztM0_level2_bc.evt | modeM0/AS1A10_071T07_9000004322cztM0_level2_quad_clean.evt |
| Size (bytes) | 2,578,893,120 | 733,835,520 |
| Size | 2.4 GB | 699.8 MB |
| Events in quadrant A | 12,990,315 | 4,709,090 |
| Events in quadrant B | 29,078,901 | 4,690,077 |
| Events in quadrant C | 14,223,760 | 4,388,499 |
| Events in quadrant D | 17,721,724 | 4,320,161 |
| Mode M0 | |||
|---|---|---|---|
| Quadrant | BADHDUFLAG | Total packets | Discarded packets |
| A | 0 | 125353 | 0 |
| B | 0 | 182241 | 0 |
| C | 0 | 134934 | 0 |
| D | 0 | 144172 | 0 |
| Mode SS | |||
|---|---|---|---|
| Quadrant | BADHDUFLAG | Total packets | Discarded packets |
| A | 0 | 1222 | 0 |
| B | 0 | 1222 | 0 |
| C | 0 | 1222 | 0 |
| D | 0 | 1222 | 0 |
| Mode M9 | |||
|---|---|---|---|
| Quadrant | BADHDUFLAG | Total packets | Discarded packets |
| A | 0 | 97 | 0 |
| B | 0 | 97 | 0 |
| C | 0 | 97 | 0 |
| D | 0 | 97 | 0 |
| Quadrant | Total seconds | Saturated seconds | Saturation percentage |
|---|---|---|---|
| A | 60033 | 719 | 1.197675% |
| B | 60033 | 1292 | 2.152150% |
| C | 60033 | 3038 | 5.060550% |
| D | 60033 | 2195 | 3.656322% |
Noise dominated data is calculated using 1-second bins in cleaned event files. If a bin has >2000 counts, and if more than 50% of those come from <1% of pixels, then it is considered to be noise-dominated and hence unusable.
| Quadrant | # 1 sec bins | Bins with >0 counts | Bins with >2000 counts | High rate bins dominated by noise | Noise dominated (total time) | Noise dominated (detector-on time) | Marked lightcurve |
|---|---|---|---|---|---|---|---|
| A | 69868 | 60037 | 0 | 0 | 0.00% | 0.00% |  |
| B | 69868 | 60032 | 10 | 10 | 0.01% | 0.02% |  |
| C | 69868 | 60018 | 26 | 26 | 0.04% | 0.04% |  |
| D | 69868 | 60034 | 50 | 50 | 0.07% | 0.08% | 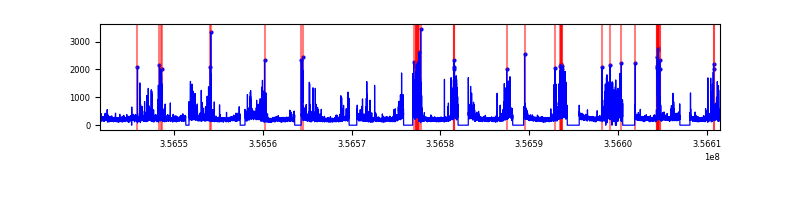 |
Top three noisy pixels from each quadrant. If the there are fewer than three noisy pixels in the level2.evt file, extra rows are filled as -1
| Pixel properties | Quadrant properties | ||||||
|---|---|---|---|---|---|---|---|
| Quadrant | DetID | PixID | Counts | Sigma | Mean | Median | Sigma |
| A | 8 | 192 | 121872 | 167.33 | 3332 | 3282 | 708.7 |
| A | 13 | 254 | 100772 | 137.56 | 3332 | 3282 | 708.7 |
| A | 0 | 226 | 20762 | 24.66 | 3332 | 3282 | 708.7 |
| B | 6 | 159 | 15974778 | 25505.38 | 3337 | 3264 | 626.2 |
| B | 5 | 255 | 115534 | 179.29 | 3337 | 3264 | 626.2 |
| B | 0 | 229 | 73930 | 112.85 | 3337 | 3264 | 626.2 |
| C | 3 | 233 | 885050 | 1213.12 | 3112 | 3103 | 727.0 |
| C | 2 | 16 | 383366 | 523.05 | 3112 | 3103 | 727.0 |
| C | 15 | 208 | 325967 | 444.1 | 3112 | 3103 | 727.0 |
| D | 13 | 104 | 2746115 | 3812.45 | 3165 | 3085 | 719.5 |
| D | 8 | 195 | 1327124 | 1840.24 | 3165 | 3085 | 719.5 |
| D | 7 | 223 | 588660 | 813.87 | 3165 | 3085 | 719.5 |
Histogram calculated using DETX and DETY for each event in the final _common_clean file
| Quadrant A | 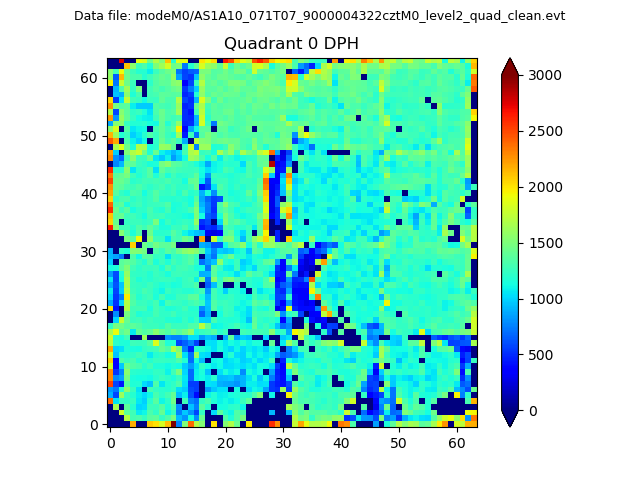 |
 |
Quadrant B |
|---|---|---|---|
| Quadrant D |  |
 |
Quadrant C |
| Plot type | Count rate plots | Images |
|---|---|---|
| Comparison with Poisson distribution Blue bars denote a histogram of data divided into 1 sec bins. Red curve is a Poisson curve with rate = median count rate of data. |
 |
 |
| Quadrant-wise count rates Data is divided into 100 sec bins |
 |
|
| Module-wise count rates for Quadrant A Data is divided into 100 sec bins |
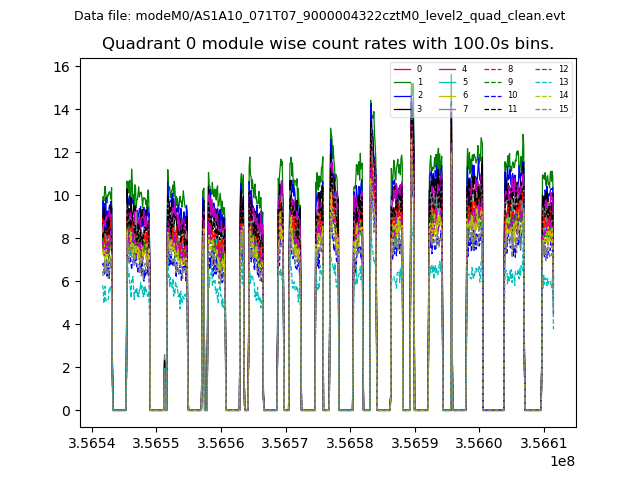 |
 |
| Module-wise count rates for Quadrant B Data is divided into 100 sec bins |
 |
 |
| Module-wise count rates for Quadrant C Data is divided into 100 sec bins |
 |
 |
| Module-wise count rates for Quadrant D Data is divided into 100 sec bins |
 |
 |
| Parameter | Plot |
|---|---|
| CZT HV Monitor |  |
| D_VDD |  |
| Temperature 1 |  |
| Veto HV Monitor | 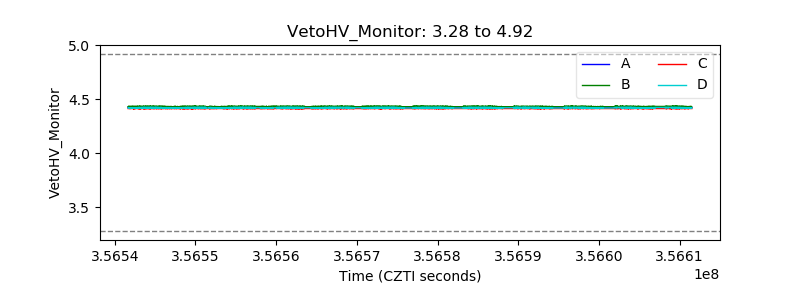 |
| Veto LLD | 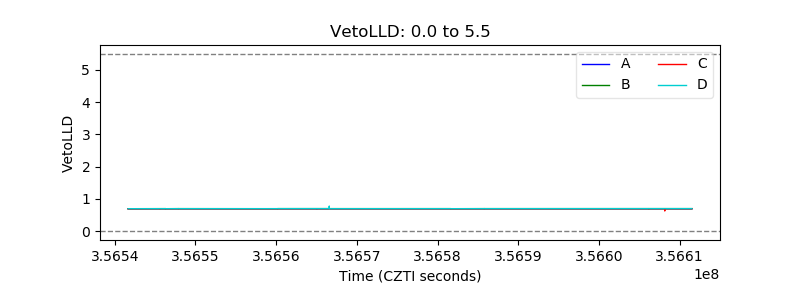 |
| Alpha Counter | 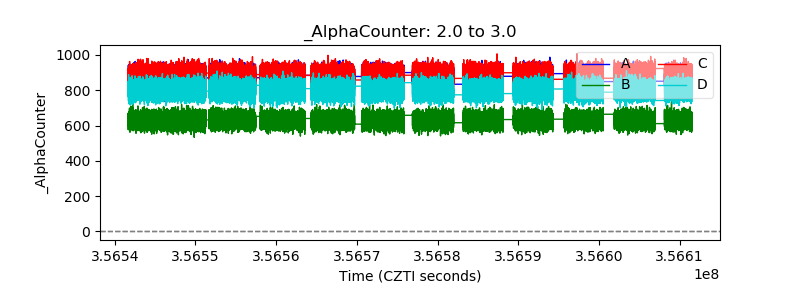 |
| _CPM_Rate | 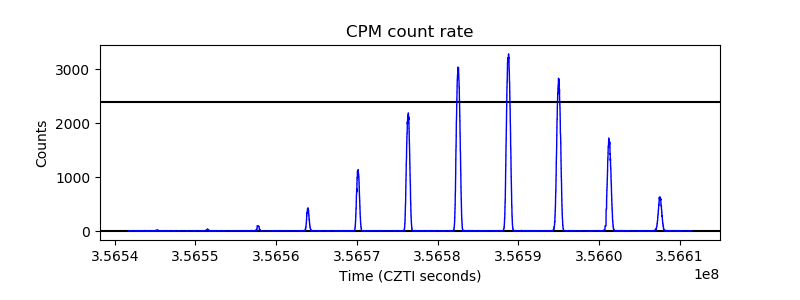 |
| CZT Counter | 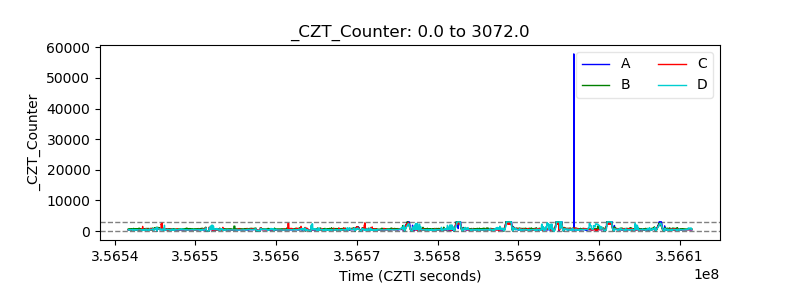 |
| +2.5 Volts monitor |  |
| +5 Volts monitor |  |
| _ROLL_ROT | 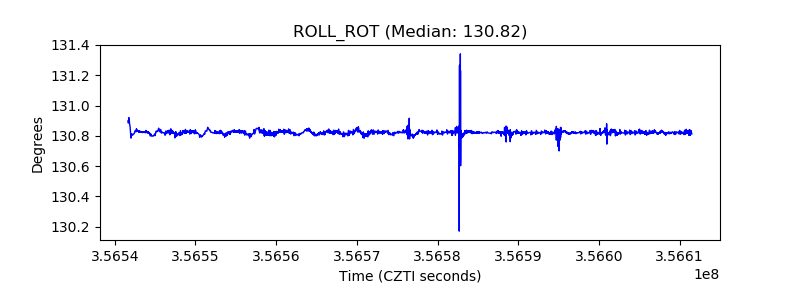 |
| _Roll_DEC |  |
| _Roll_RA |  |
| Veto Counter |  |