| Param | Original file | Final file |
|---|---|---|
| Filename | modeM0/AS1A10_082T06_9000004318cztM0_level2_bc.evt | modeM0/AS1A10_082T06_9000004318cztM0_level2_quad_clean.evt |
| Size (bytes) | 1,041,307,200 | 326,972,160 |
| Size | 993.1 MB | 311.8 MB |
| Events in quadrant A | 5,319,032 | 2,085,709 |
| Events in quadrant B | 12,787,134 | 2,060,085 |
| Events in quadrant C | 5,209,691 | 2,002,525 |
| Events in quadrant D | 6,474,957 | 1,997,080 |
| Mode M0 | |||
|---|---|---|---|
| Quadrant | BADHDUFLAG | Total packets | Discarded packets |
| A | 0 | 53224 | 0 |
| B | 0 | 78913 | 0 |
| C | 0 | 53430 | 0 |
| D | 0 | 55553 | 0 |
| Mode M9 | |||
|---|---|---|---|
| Quadrant | BADHDUFLAG | Total packets | Discarded packets |
| A | 0 | 24 | 0 |
| B | 0 | 24 | 0 |
| C | 0 | 24 | 0 |
| D | 0 | 24 | 0 |
| Mode SS | |||
|---|---|---|---|
| Quadrant | BADHDUFLAG | Total packets | Discarded packets |
| A | 0 | 522 | 0 |
| B | 0 | 522 | 0 |
| C | 0 | 522 | 0 |
| D | 0 | 522 | 0 |
| Quadrant | Total seconds | Saturated seconds | Saturation percentage |
|---|---|---|---|
| A | 25556 | 472 | 1.846924% |
| B | 25556 | 861 | 3.369072% |
| C | 25556 | 665 | 2.602129% |
| D | 25556 | 419 | 1.639537% |
Noise dominated data is calculated using 1-second bins in cleaned event files. If a bin has >2000 counts, and if more than 50% of those come from <1% of pixels, then it is considered to be noise-dominated and hence unusable.
| Quadrant | # 1 sec bins | Bins with >0 counts | Bins with >2000 counts | High rate bins dominated by noise | Noise dominated (total time) | Noise dominated (detector-on time) | Marked lightcurve |
|---|---|---|---|---|---|---|---|
| A | 28016 | 25555 | 0 | 0 | 0.00% | 0.00% |  |
| B | 28016 | 25555 | 11 | 11 | 0.04% | 0.04% |  |
| C | 28016 | 25557 | 0 | 0 | 0.00% | 0.00% | 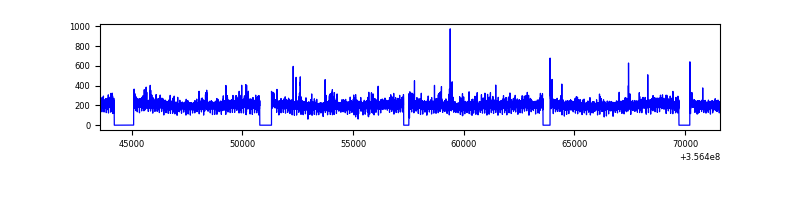 |
| D | 28016 | 25557 | 34 | 34 | 0.12% | 0.13% |  |
Top three noisy pixels from each quadrant. If the there are fewer than three noisy pixels in the level2.evt file, extra rows are filled as -1
| Pixel properties | Quadrant properties | ||||||
|---|---|---|---|---|---|---|---|
| Quadrant | DetID | PixID | Counts | Sigma | Mean | Median | Sigma |
| A | 8 | 192 | 57579 | 191.31 | 1355 | 1334 | 294.0 |
| A | 13 | 254 | 47411 | 156.72 | 1355 | 1334 | 294.0 |
| A | 3 | 1 | 10909 | 32.57 | 1355 | 1334 | 294.0 |
| B | 6 | 159 | 7044399 | 27192.97 | 1347 | 1314 | 259.0 |
| B | 0 | 190 | 249399 | 957.84 | 1347 | 1314 | 259.0 |
| B | 5 | 255 | 208727 | 800.81 | 1347 | 1314 | 259.0 |
| C | 3 | 233 | 114484 | 369.18 | 1296 | 1290 | 306.6 |
| C | 2 | 114 | 49824 | 158.29 | 1296 | 1290 | 306.6 |
| C | 14 | 254 | 38141 | 120.19 | 1296 | 1290 | 306.6 |
| D | 8 | 195 | 701758 | 2210.2 | 1322 | 1283 | 316.9 |
| D | 13 | 138 | 180275 | 564.77 | 1322 | 1283 | 316.9 |
| D | 2 | 250 | 132900 | 415.29 | 1322 | 1283 | 316.9 |
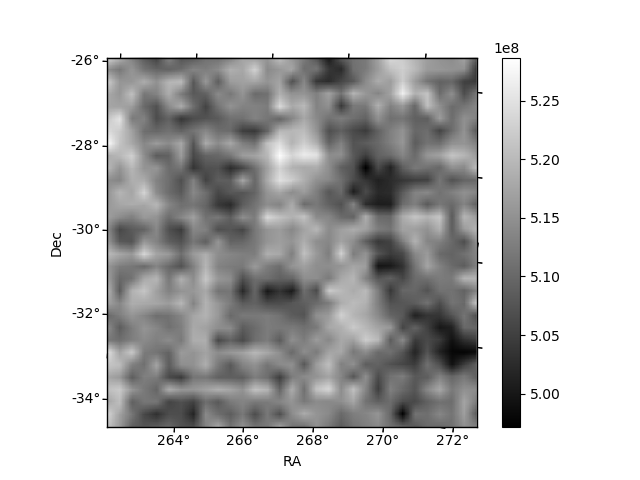
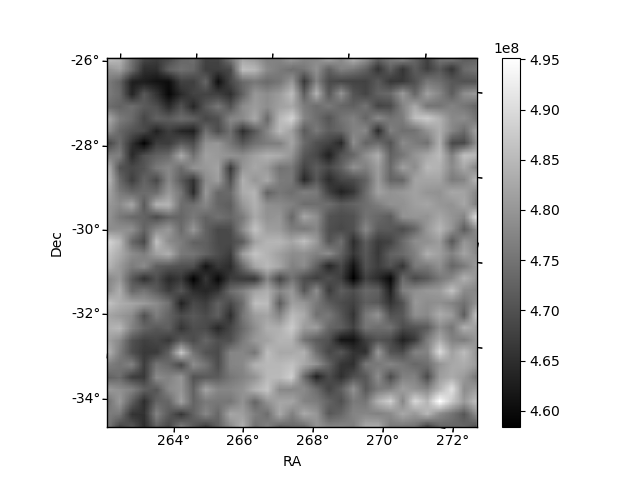
Histogram calculated using DETX and DETY for each event in the final _common_clean file
| Quadrant A |  |
 |
Quadrant B |
|---|---|---|---|
| Quadrant D | 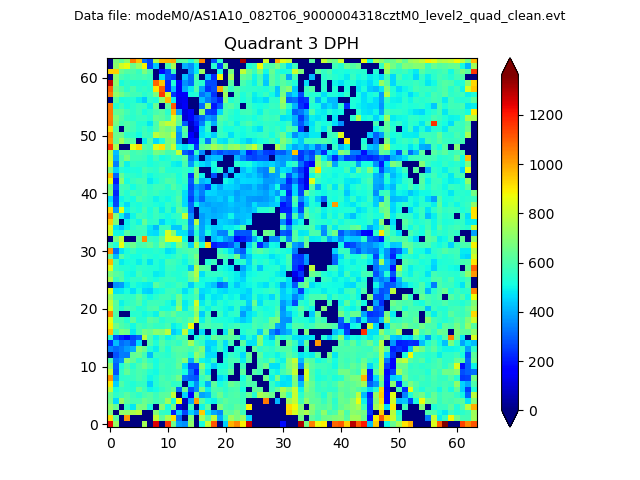 |
 |
Quadrant C |
| Plot type | Count rate plots | Images |
|---|---|---|
| Comparison with Poisson distribution Blue bars denote a histogram of data divided into 1 sec bins. Red curve is a Poisson curve with rate = median count rate of data. |
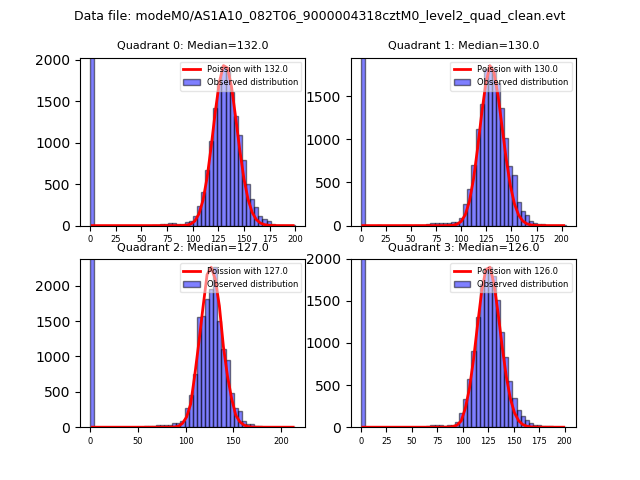 |
 |
| Quadrant-wise count rates Data is divided into 100 sec bins |
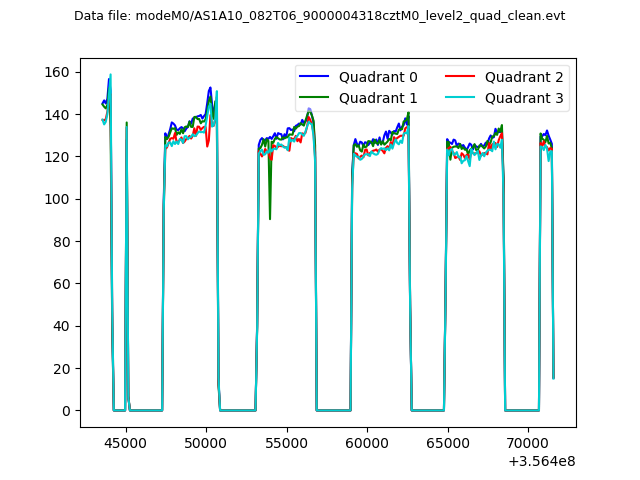 |
|
| Module-wise count rates for Quadrant A Data is divided into 100 sec bins |
 |
 |
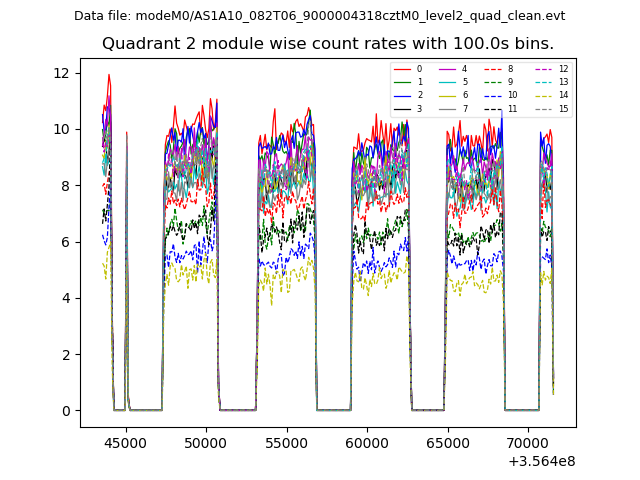
| Module-wise count rates for Quadrant B Data is divided into 100 sec bins |
 |
 |
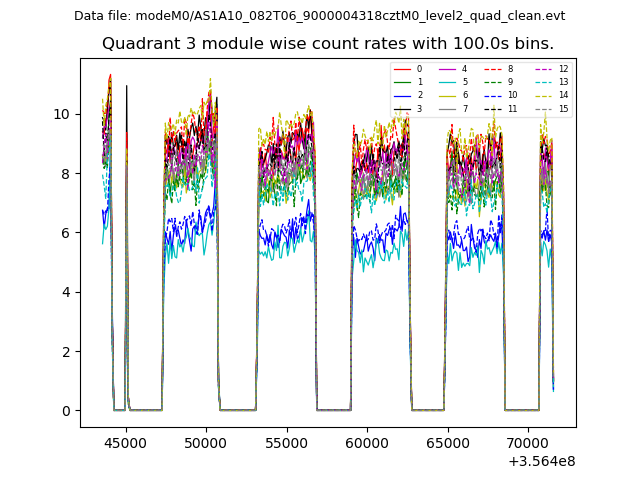
| Module-wise count rates for Quadrant C Data is divided into 100 sec bins |
 |
 |
| Module-wise count rates for Quadrant D Data is divided into 100 sec bins |
 |
 |
| Parameter | Plot |
|---|---|
| CZT HV Monitor | 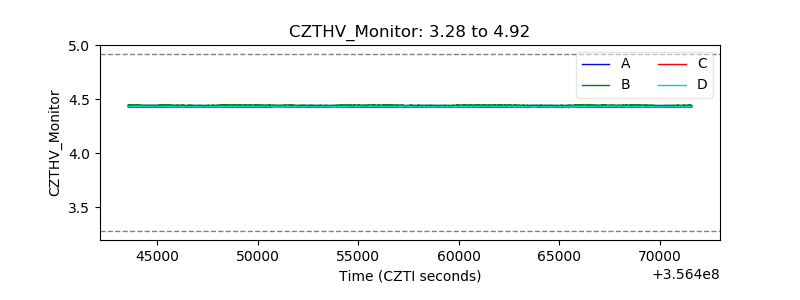 |
| D_VDD | 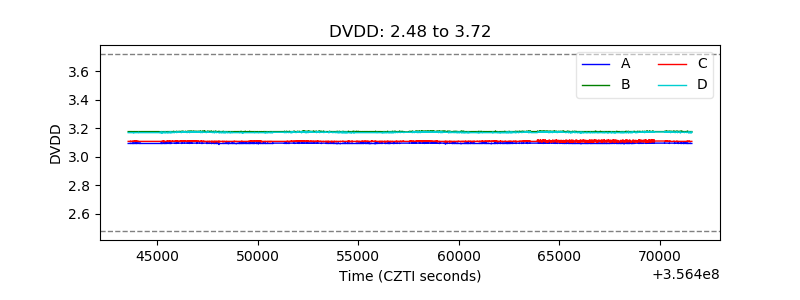 |
| Temperature 1 |  |
| Veto HV Monitor |  |
| Veto LLD |  |
| Alpha Counter |  |
| _CPM_Rate |  |
| CZT Counter | 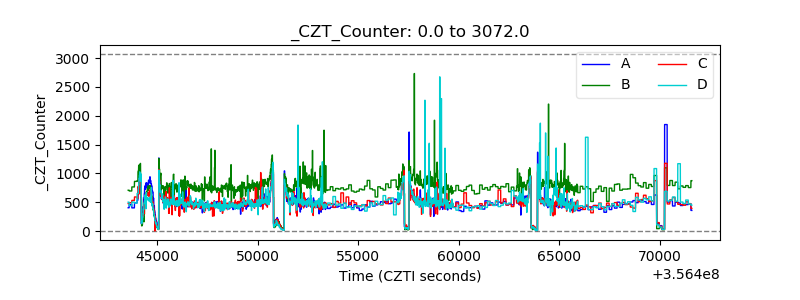 |
| +2.5 Volts monitor |  |
| +5 Volts monitor |  |
| _ROLL_ROT |  |
| _Roll_DEC |  |
| _Roll_RA |  |
| Veto Counter |  |