| Param | Original file | Final file |
|---|---|---|
| Filename | modeM0/AS1A10_071T09_9000004320cztM0_level2_bc.evt | modeM0/AS1A10_071T09_9000004320cztM0_level2_quad_clean.evt |
| Size (bytes) | 2,369,445,120 | 731,854,080 |
| Size | 2.2 GB | 698.0 MB |
| Events in quadrant A | 12,667,293 | 4,687,360 |
| Events in quadrant B | 28,168,761 | 4,667,717 |
| Events in quadrant C | 12,695,773 | 4,433,775 |
| Events in quadrant D | 14,302,920 | 4,423,856 |
| Mode SS | |||
|---|---|---|---|
| Quadrant | BADHDUFLAG | Total packets | Discarded packets |
| A | 0 | 1180 | 0 |
| B | 0 | 1180 | 0 |
| C | 0 | 1180 | 0 |
| D | 0 | 1180 | 0 |
| Mode M0 | |||
|---|---|---|---|
| Quadrant | BADHDUFLAG | Total packets | Discarded packets |
| A | 0 | 120406 | 0 |
| B | 0 | 175013 | 0 |
| C | 0 | 122945 | 0 |
| D | 0 | 122684 | 0 |
| Mode M9 | |||
|---|---|---|---|
| Quadrant | BADHDUFLAG | Total packets | Discarded packets |
| A | 0 | 104 | 0 |
| B | 0 | 104 | 0 |
| C | 0 | 104 | 0 |
| D | 0 | 104 | 0 |
| Quadrant | Total seconds | Saturated seconds | Saturation percentage |
|---|---|---|---|
| A | 57634 | 662 | 1.148628% |
| B | 57634 | 1164 | 2.019641% |
| C | 57634 | 1333 | 2.312871% |
| D | 57634 | 427 | 0.740882% |
Noise dominated data is calculated using 1-second bins in cleaned event files. If a bin has >2000 counts, and if more than 50% of those come from <1% of pixels, then it is considered to be noise-dominated and hence unusable.
| Quadrant | # 1 sec bins | Bins with >0 counts | Bins with >2000 counts | High rate bins dominated by noise | Noise dominated (total time) | Noise dominated (detector-on time) | Marked lightcurve |
|---|---|---|---|---|---|---|---|
| A | 68279 | 57635 | 1 | 1 | 0.00% | 0.00% |  |
| B | 68279 | 57635 | 17 | 17 | 0.02% | 0.03% |  |
| C | 68279 | 57633 | 13 | 13 | 0.02% | 0.02% |  |
| D | 68279 | 57634 | 17 | 17 | 0.02% | 0.03% |  |
Top three noisy pixels from each quadrant. If the there are fewer than three noisy pixels in the level2.evt file, extra rows are filled as -1
| Pixel properties | Quadrant properties | ||||||
|---|---|---|---|---|---|---|---|
| Quadrant | DetID | PixID | Counts | Sigma | Mean | Median | Sigma |
| A | 8 | 192 | 133113 | 188.83 | 3237 | 3185 | 688.1 |
| A | 13 | 254 | 101048 | 142.22 | 3237 | 3185 | 688.1 |
| A | 12 | 96 | 49192 | 66.86 | 3237 | 3185 | 688.1 |
| B | 6 | 159 | 15317239 | 25097.51 | 3243 | 3168 | 610.2 |
| B | 5 | 255 | 248552 | 402.15 | 3243 | 3168 | 610.2 |
| B | 0 | 190 | 67227 | 104.98 | 3243 | 3168 | 610.2 |
| C | 3 | 233 | 495320 | 690.16 | 3060 | 3054 | 713.3 |
| C | 15 | 208 | 187934 | 259.2 | 3060 | 3054 | 713.3 |
| C | 2 | 114 | 106585 | 145.15 | 3060 | 3054 | 713.3 |
| D | 8 | 195 | 1545799 | 2194.09 | 3117 | 3038 | 703.1 |
| D | 2 | 250 | 370390 | 522.44 | 3117 | 3038 | 703.1 |
| D | 2 | 234 | 211639 | 296.67 | 3117 | 3038 | 703.1 |
Histogram calculated using DETX and DETY for each event in the final _common_clean file
| Quadrant A |  |
 |
Quadrant B |
|---|---|---|---|
| Quadrant D | 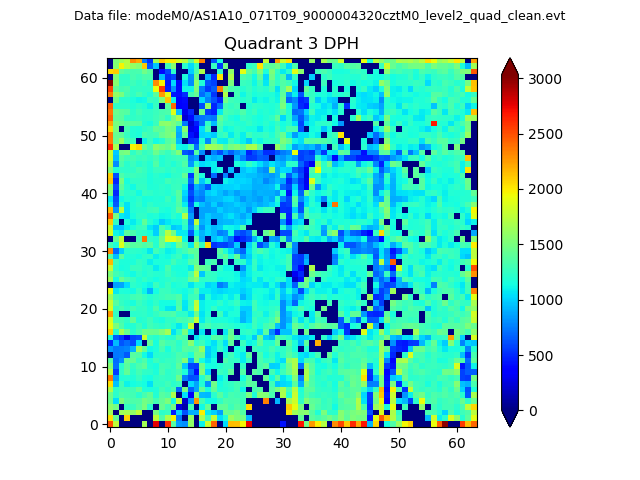 |
 |
Quadrant C |
| Plot type | Count rate plots | Images |
|---|---|---|
| Comparison with Poisson distribution Blue bars denote a histogram of data divided into 1 sec bins. Red curve is a Poisson curve with rate = median count rate of data. |
 |
 |
| Quadrant-wise count rates Data is divided into 100 sec bins |
 |
|
| Module-wise count rates for Quadrant A Data is divided into 100 sec bins |
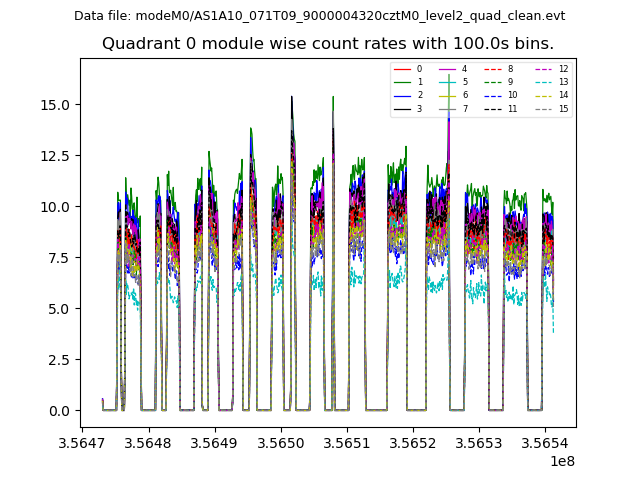 |
 |
| Module-wise count rates for Quadrant B Data is divided into 100 sec bins |
 |
 |
| Module-wise count rates for Quadrant C Data is divided into 100 sec bins |
 |
 |
| Module-wise count rates for Quadrant D Data is divided into 100 sec bins |
 |
 |
| Parameter | Plot |
|---|---|
| CZT HV Monitor | 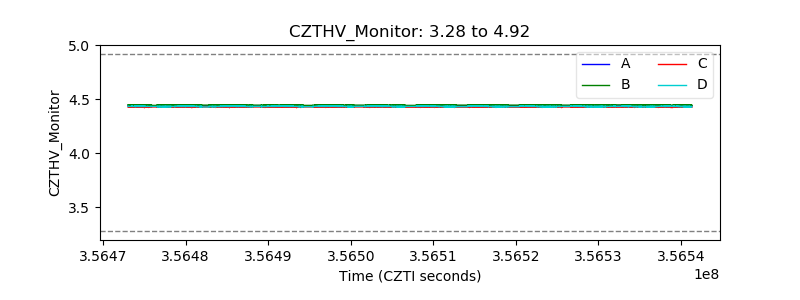 |
| D_VDD |  |
| Temperature 1 |  |
| Veto HV Monitor | 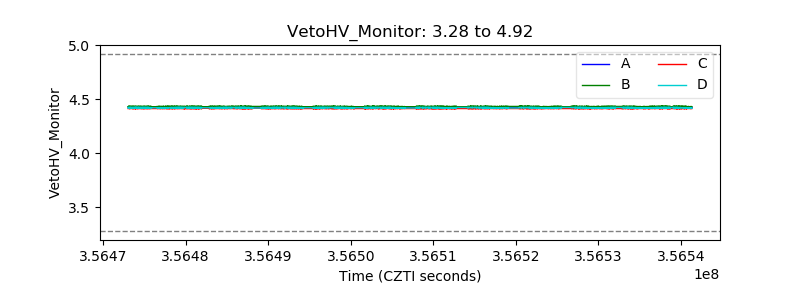 |
| Veto LLD |  |
| Alpha Counter | 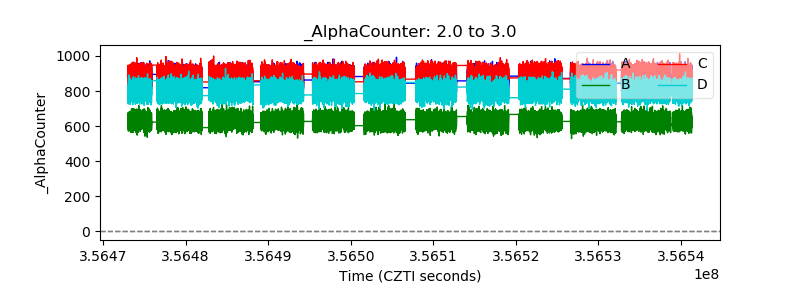 |
| _CPM_Rate |  |
| CZT Counter |  |
| +2.5 Volts monitor |  |
| +5 Volts monitor | 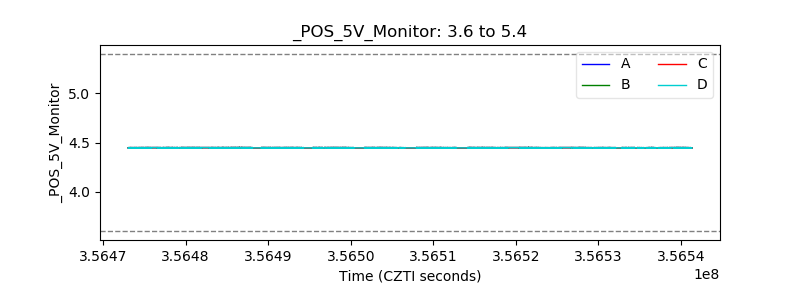 |
| _ROLL_ROT | 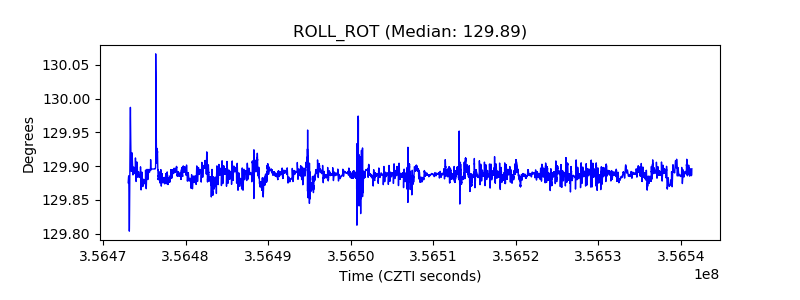 |
| _Roll_DEC |  |
| _Roll_RA |  |
| Veto Counter |  |