| Param | Original file | Final file |
|---|---|---|
| Filename | modeM0/AS1A10_071T04_9000004316cztM0_level2_bc.evt | modeM0/AS1A10_071T04_9000004316cztM0_level2_quad_clean.evt |
| Size (bytes) | 2,477,113,920 | 738,570,240 |
| Size | 2.3 GB | 704.4 MB |
| Events in quadrant A | 12,970,405 | 4,700,828 |
| Events in quadrant B | 28,811,953 | 4,682,860 |
| Events in quadrant C | 13,293,197 | 4,462,847 |
| Events in quadrant D | 15,905,407 | 4,453,110 |
| Mode M9 | |||
|---|---|---|---|
| Quadrant | BADHDUFLAG | Total packets | Discarded packets |
| A | 0 | 99 | 0 |
| B | 0 | 99 | 0 |
| C | 0 | 99 | 0 |
| D | 0 | 99 | 0 |
| Mode SS | |||
|---|---|---|---|
| Quadrant | BADHDUFLAG | Total packets | Discarded packets |
| A | 0 | 1208 | 0 |
| B | 0 | 1208 | 0 |
| C | 0 | 1208 | 0 |
| D | 0 | 1208 | 0 |
| Mode M0 | |||
|---|---|---|---|
| Quadrant | BADHDUFLAG | Total packets | Discarded packets |
| A | 0 | 124353 | 0 |
| B | 0 | 179955 | 0 |
| C | 0 | 127803 | 0 |
| D | 0 | 131394 | 0 |
| Quadrant | Total seconds | Saturated seconds | Saturation percentage |
|---|---|---|---|
| A | 59358 | 723 | 1.218033% |
| B | 59358 | 1253 | 2.110920% |
| C | 59358 | 1381 | 2.326561% |
| D | 59358 | 571 | 0.961960% |
Noise dominated data is calculated using 1-second bins in cleaned event files. If a bin has >2000 counts, and if more than 50% of those come from <1% of pixels, then it is considered to be noise-dominated and hence unusable.
| Quadrant | # 1 sec bins | Bins with >0 counts | Bins with >2000 counts | High rate bins dominated by noise | Noise dominated (total time) | Noise dominated (detector-on time) | Marked lightcurve |
|---|---|---|---|---|---|---|---|
| A | 69098 | 59362 | 1 | 1 | 0.00% | 0.00% | 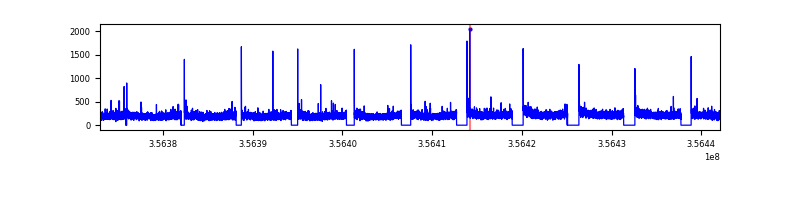 |
| B | 69098 | 59361 | 6 | 6 | 0.01% | 0.01% |  |
| C | 69098 | 59362 | 2 | 2 | 0.00% | 0.00% |  |
| D | 69098 | 59360 | 54 | 54 | 0.08% | 0.09% |  |
Top three noisy pixels from each quadrant. If the there are fewer than three noisy pixels in the level2.evt file, extra rows are filled as -1
| Pixel properties | Quadrant properties | ||||||
|---|---|---|---|---|---|---|---|
| Quadrant | DetID | PixID | Counts | Sigma | Mean | Median | Sigma |
| A | 8 | 192 | 126476 | 174.33 | 3322 | 3270 | 706.8 |
| A | 13 | 254 | 103892 | 142.37 | 3322 | 3270 | 706.8 |
| A | 12 | 96 | 22840 | 27.69 | 3322 | 3270 | 706.8 |
| B | 6 | 159 | 15966173 | 25591.71 | 3319 | 3245 | 623.8 |
| B | 10 | 247 | 76439 | 117.34 | 3319 | 3245 | 623.8 |
| B | 0 | 183 | 63249 | 96.2 | 3319 | 3245 | 623.8 |
| C | 3 | 233 | 852392 | 1166.99 | 3137 | 3132 | 727.7 |
| C | 15 | 208 | 145597 | 195.76 | 3137 | 3132 | 727.7 |
| C | 2 | 114 | 111201 | 148.5 | 3137 | 3132 | 727.7 |
| D | 8 | 195 | 1488730 | 2047.92 | 3201 | 3123 | 725.4 |
| D | 7 | 80 | 1383787 | 1903.25 | 3201 | 3123 | 725.4 |
| D | 1 | 52 | 408168 | 558.36 | 3201 | 3123 | 725.4 |
Histogram calculated using DETX and DETY for each event in the final _common_clean file
| Quadrant A |  |
 |
Quadrant B |
|---|---|---|---|
| Quadrant D |  |
 |
Quadrant C |
| Plot type | Count rate plots | Images |
|---|---|---|
| Comparison with Poisson distribution Blue bars denote a histogram of data divided into 1 sec bins. Red curve is a Poisson curve with rate = median count rate of data. |
 |
 |
| Quadrant-wise count rates Data is divided into 100 sec bins |
 |
|
| Module-wise count rates for Quadrant A Data is divided into 100 sec bins |
 |
 |
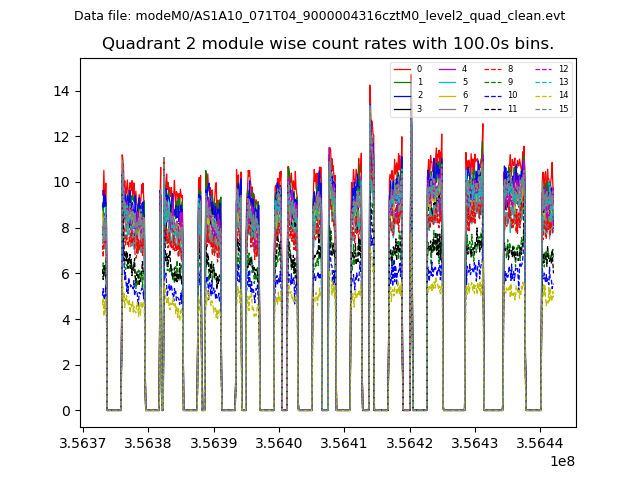
| Module-wise count rates for Quadrant B Data is divided into 100 sec bins |
 |
 |
| Module-wise count rates for Quadrant C Data is divided into 100 sec bins |
 |
 |
| Module-wise count rates for Quadrant D Data is divided into 100 sec bins |
 |
 |
| Parameter | Plot |
|---|---|
| CZT HV Monitor |  |
| D_VDD |  |
| Temperature 1 |  |
| Veto HV Monitor |  |
| Veto LLD |  |
| Alpha Counter |  |
| _CPM_Rate |  |
| CZT Counter |  |
| +2.5 Volts monitor |  |
| +5 Volts monitor |  |
| _ROLL_ROT |  |
| _Roll_DEC |  |
| _Roll_RA |  |
| Veto Counter |  |