| Param | Original file | Final file |
|---|---|---|
| Filename | modeM0/AS1A10_071T03_9000004314cztM0_level2_bc.evt | modeM0/AS1A10_071T03_9000004314cztM0_level2_quad_clean.evt |
| Size (bytes) | 2,284,404,480 | 711,576,000 |
| Size | 2.1 GB | 678.6 MB |
| Events in quadrant A | 12,325,575 | 4,610,136 |
| Events in quadrant B | 26,367,175 | 4,572,041 |
| Events in quadrant C | 11,587,053 | 4,348,147 |
| Events in quadrant D | 15,235,461 | 4,325,859 |
| Mode M9 | |||
|---|---|---|---|
| Quadrant | BADHDUFLAG | Total packets | Discarded packets |
| A | 0 | 96 | 0 |
| B | 0 | 96 | 0 |
| C | 0 | 96 | 0 |
| D | 0 | 96 | 0 |
| Mode M0 | |||
|---|---|---|---|
| Quadrant | BADHDUFLAG | Total packets | Discarded packets |
| A | 0 | 114197 | 0 |
| B | 0 | 163909 | 0 |
| C | 0 | 113898 | 0 |
| D | 0 | 122107 | 0 |
| Mode SS | |||
|---|---|---|---|
| Quadrant | BADHDUFLAG | Total packets | Discarded packets |
| A | 0 | 1102 | 0 |
| B | 0 | 1102 | 0 |
| C | 0 | 1102 | 0 |
| D | 0 | 1102 | 0 |
| Quadrant | Total seconds | Saturated seconds | Saturation percentage |
|---|---|---|---|
| A | 53881 | 797 | 1.479186% |
| B | 53881 | 1325 | 2.459123% |
| C | 53881 | 1088 | 2.019265% |
| D | 53881 | 910 | 1.688907% |
Noise dominated data is calculated using 1-second bins in cleaned event files. If a bin has >2000 counts, and if more than 50% of those come from <1% of pixels, then it is considered to be noise-dominated and hence unusable.
| Quadrant | # 1 sec bins | Bins with >0 counts | Bins with >2000 counts | High rate bins dominated by noise | Noise dominated (total time) | Noise dominated (detector-on time) | Marked lightcurve |
|---|---|---|---|---|---|---|---|
| A | 63661 | 53884 | 1 | 1 | 0.00% | 0.00% |  |
| B | 63661 | 53883 | 5 | 5 | 0.01% | 0.01% |  |
| C | 63661 | 53882 | 1 | 1 | 0.00% | 0.00% |  |
| D | 63661 | 53881 | 85 | 85 | 0.13% | 0.16% |  |
Top three noisy pixels from each quadrant. If the there are fewer than three noisy pixels in the level2.evt file, extra rows are filled as -1
| Pixel properties | Quadrant properties | ||||||
|---|---|---|---|---|---|---|---|
| Quadrant | DetID | PixID | Counts | Sigma | Mean | Median | Sigma |
| A | 5 | 203 | 157853 | 234.47 | 3107 | 3061 | 660.2 |
| A | 8 | 192 | 113839 | 167.8 | 3107 | 3061 | 660.2 |
| A | 13 | 254 | 93388 | 136.82 | 3107 | 3061 | 660.2 |
| B | 6 | 159 | 14266783 | 24377.07 | 3094 | 3030 | 585.1 |
| B | 10 | 247 | 96849 | 160.34 | 3094 | 3030 | 585.1 |
| B | 6 | 36 | 73637 | 120.67 | 3094 | 3030 | 585.1 |
| C | 3 | 233 | 180640 | 260.46 | 2923 | 2921 | 682.3 |
| C | 2 | 114 | 101197 | 144.03 | 2923 | 2921 | 682.3 |
| C | 0 | 10 | 34006 | 45.56 | 2923 | 2921 | 682.3 |
| D | 7 | 80 | 1711523 | 2520.77 | 2975 | 2902 | 677.8 |
| D | 8 | 195 | 1291846 | 1901.61 | 2975 | 2902 | 677.8 |
| D | 7 | 223 | 314090 | 459.1 | 2975 | 2902 | 677.8 |
Histogram calculated using DETX and DETY for each event in the final _common_clean file
| Quadrant A |  |
 |
Quadrant B |
|---|---|---|---|
| Quadrant D |  |
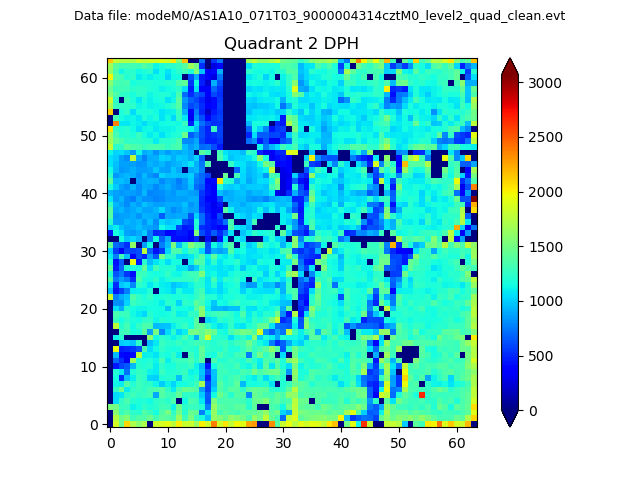 |
Quadrant C |
| Plot type | Count rate plots | Images |
|---|---|---|
| Comparison with Poisson distribution Blue bars denote a histogram of data divided into 1 sec bins. Red curve is a Poisson curve with rate = median count rate of data. |
 |
 |
| Quadrant-wise count rates Data is divided into 100 sec bins |
 |
|
| Module-wise count rates for Quadrant A Data is divided into 100 sec bins |
 |
 |
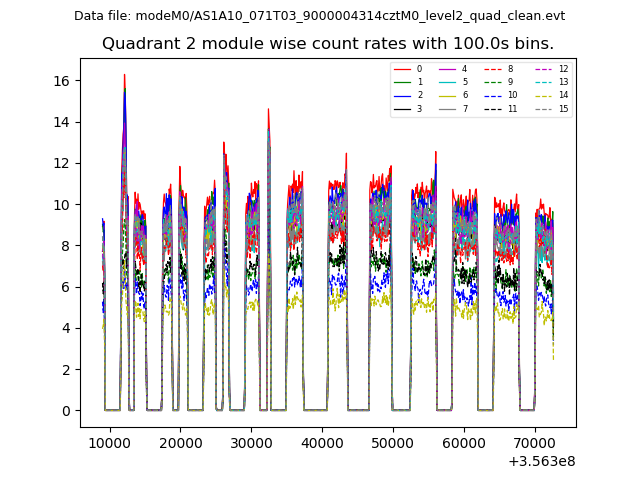
| Module-wise count rates for Quadrant B Data is divided into 100 sec bins |
 |
 |
| Module-wise count rates for Quadrant C Data is divided into 100 sec bins |
 |
 |
| Module-wise count rates for Quadrant D Data is divided into 100 sec bins |
 |
 |
| Parameter | Plot |
|---|---|
| CZT HV Monitor |  |
| D_VDD |  |
| Temperature 1 |  |
| Veto HV Monitor |  |
| Veto LLD |  |
| Alpha Counter |  |
| _CPM_Rate |  |
| CZT Counter |  |
| +2.5 Volts monitor |  |
| +5 Volts monitor |  |
| _ROLL_ROT |  |
| _Roll_DEC |  |
| _Roll_RA |  |
| Veto Counter |  |