| Param | Original file | Final file |
|---|---|---|
| Filename | modeM0/AS1A10_071T02_9000004312cztM0_level2_bc.evt | modeM0/AS1A10_071T02_9000004312cztM0_level2_quad_clean.evt |
| Size (bytes) | 1,888,761,600 | 502,767,360 |
| Size | 1.8 GB | 479.5 MB |
| Events in quadrant A | 8,478,250 | 3,330,235 |
| Events in quadrant B | 23,722,523 | 3,025,371 |
| Events in quadrant C | 8,445,592 | 3,168,187 |
| Events in quadrant D | 13,978,868 | 3,107,303 |
| Mode M9 | |||
|---|---|---|---|
| Quadrant | BADHDUFLAG | Total packets | Discarded packets |
| A | 0 | 39 | 0 |
| B | 0 | 39 | 0 |
| C | 0 | 39 | 0 |
| D | 0 | 39 | 0 |
| Mode SS | |||
|---|---|---|---|
| Quadrant | BADHDUFLAG | Total packets | Discarded packets |
| A | 0 | 774 | 0 |
| B | 0 | 774 | 0 |
| C | 0 | 774 | 0 |
| D | 0 | 774 | 0 |
| Mode M0 | |||
|---|---|---|---|
| Quadrant | BADHDUFLAG | Total packets | Discarded packets |
| A | 0 | 80671 | 0 |
| B | 0 | 140391 | 0 |
| C | 0 | 82257 | 0 |
| D | 0 | 99137 | 0 |
| Quadrant | Total seconds | Saturated seconds | Saturation percentage |
|---|---|---|---|
| A | 37776 | 750 | 1.985388% |
| B | 37776 | 5708 | 15.110123% |
| C | 37776 | 1292 | 3.420161% |
| D | 37776 | 2460 | 6.512071% |
Noise dominated data is calculated using 1-second bins in cleaned event files. If a bin has >2000 counts, and if more than 50% of those come from <1% of pixels, then it is considered to be noise-dominated and hence unusable.
| Quadrant | # 1 sec bins | Bins with >0 counts | Bins with >2000 counts | High rate bins dominated by noise | Noise dominated (total time) | Noise dominated (detector-on time) | Marked lightcurve |
|---|---|---|---|---|---|---|---|
| A | 41866 | 37778 | 0 | 0 | 0.00% | 0.00% | 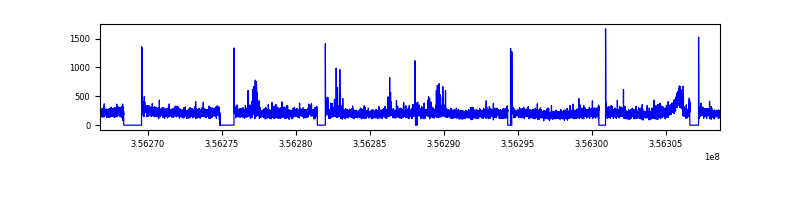 |
| B | 41866 | 37777 | 402 | 402 | 0.96% | 1.06% |  |
| C | 41866 | 37779 | 3 | 3 | 0.01% | 0.01% | 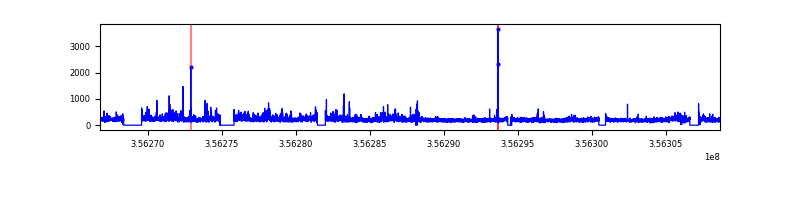 |
| D | 41866 | 37777 | 722 | 722 | 1.72% | 1.91% |  |
Top three noisy pixels from each quadrant. If the there are fewer than three noisy pixels in the level2.evt file, extra rows are filled as -1
| Pixel properties | Quadrant properties | ||||||
|---|---|---|---|---|---|---|---|
| Quadrant | DetID | PixID | Counts | Sigma | Mean | Median | Sigma |
| A | 5 | 203 | 141035 | 303.38 | 2098 | 2065 | 458.1 |
| A | 3 | 1 | 81256 | 172.88 | 2098 | 2065 | 458.1 |
| A | 8 | 192 | 79607 | 169.28 | 2098 | 2065 | 458.1 |
| B | 6 | 159 | 9443286 | 25034.55 | 1928 | 1879 | 377.1 |
| B | 6 | 36 | 6774225 | 17957.35 | 1928 | 1879 | 377.1 |
| B | 0 | 183 | 57459 | 147.37 | 1928 | 1879 | 377.1 |
| C | 3 | 233 | 811956 | 1741.43 | 1957 | 1946 | 465.1 |
| C | 2 | 114 | 70806 | 148.04 | 1957 | 1946 | 465.1 |
| C | 14 | 254 | 31449 | 63.43 | 1957 | 1946 | 465.1 |
| D | 7 | 80 | 4881746 | 10407.42 | 1981 | 1930 | 468.9 |
| D | 8 | 195 | 1136449 | 2419.64 | 1981 | 1930 | 468.9 |
| D | 2 | 234 | 156618 | 329.91 | 1981 | 1930 | 468.9 |
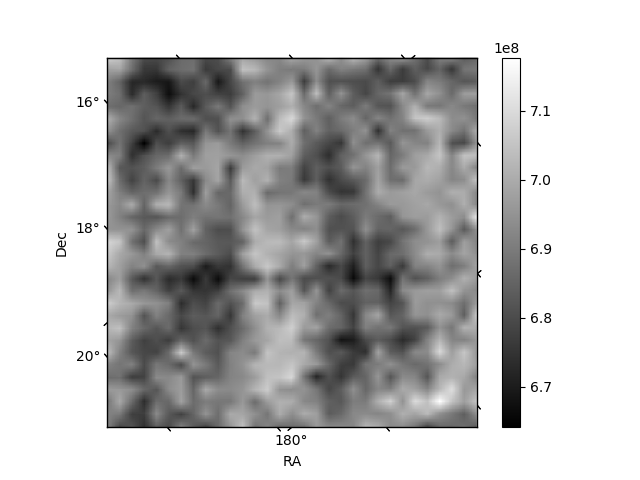
Histogram calculated using DETX and DETY for each event in the final _common_clean file
| Quadrant A | 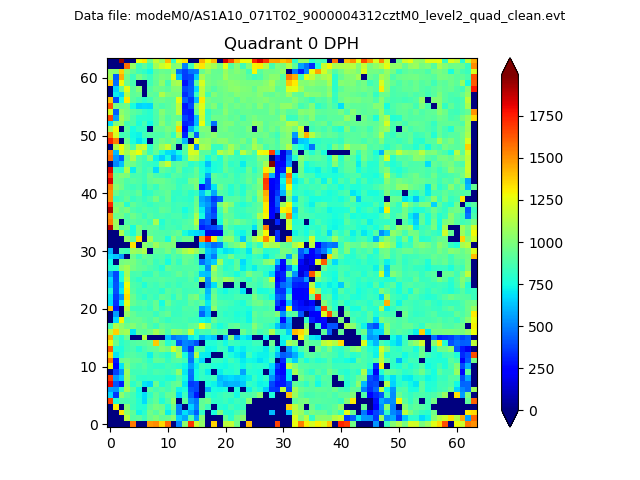 |
 |
Quadrant B |
|---|---|---|---|
| Quadrant D | 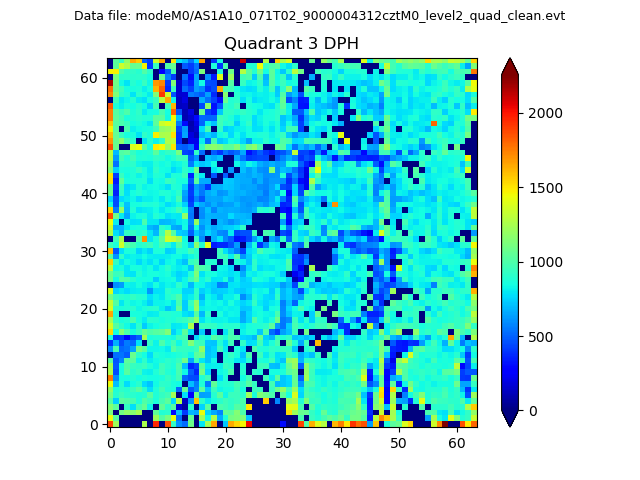 |
 |
Quadrant C |
| Plot type | Count rate plots | Images |
|---|---|---|
| Comparison with Poisson distribution Blue bars denote a histogram of data divided into 1 sec bins. Red curve is a Poisson curve with rate = median count rate of data. |
 |
 |
| Quadrant-wise count rates Data is divided into 100 sec bins |
 |
|
| Module-wise count rates for Quadrant A Data is divided into 100 sec bins |
 |
 |
| Module-wise count rates for Quadrant B Data is divided into 100 sec bins |
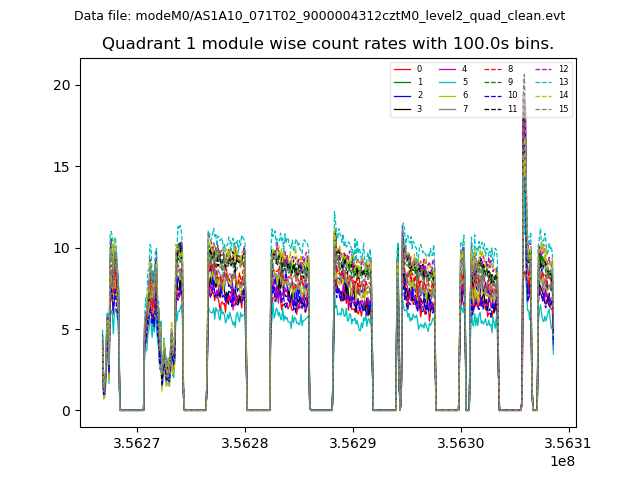 |
 |
| Module-wise count rates for Quadrant C Data is divided into 100 sec bins |
 |
 |
| Module-wise count rates for Quadrant D Data is divided into 100 sec bins |
 |
 |
| Parameter | Plot |
|---|---|
| CZT HV Monitor |  |
| D_VDD |  |
| Temperature 1 |  |
| Veto HV Monitor |  |
| Veto LLD |  |
| Alpha Counter | 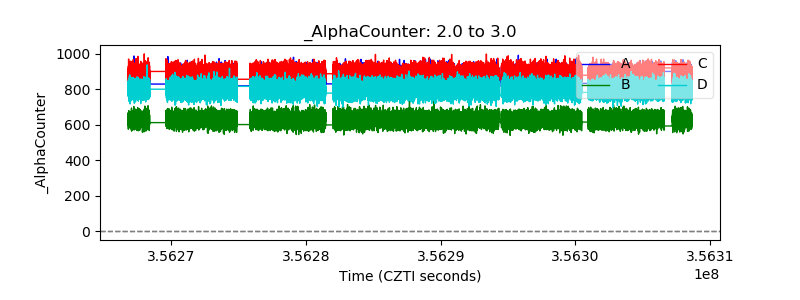 |
| _CPM_Rate |  |
| CZT Counter |  |
| +2.5 Volts monitor |  |
| +5 Volts monitor |  |
| _ROLL_ROT | 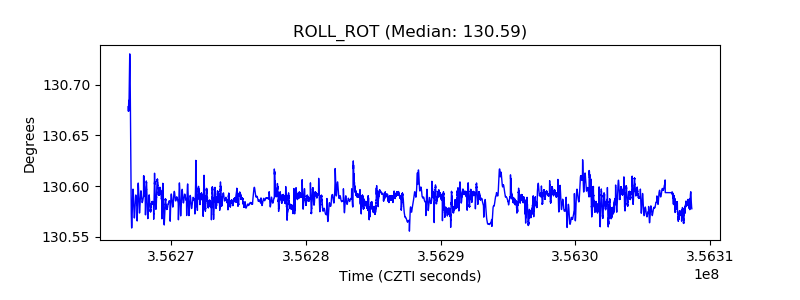 |
| _Roll_DEC |  |
| _Roll_RA |  |
| Veto Counter | 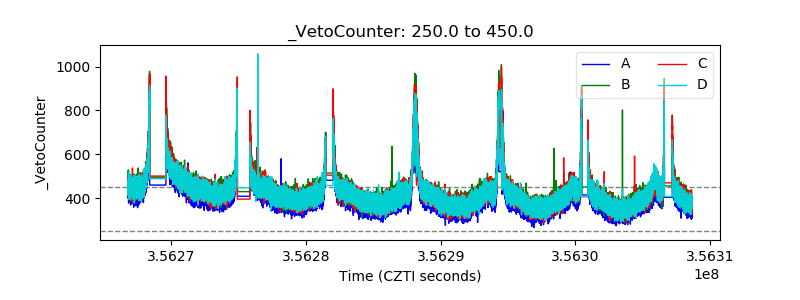 |