| Param | Original file | Final file |
|---|---|---|
| Filename | modeM0/AS1A10_071T01_9000004310cztM0_level2_bc.evt | modeM0/AS1A10_071T01_9000004310cztM0_level2_quad_clean.evt |
| Size (bytes) | 3,112,896,960 | 727,355,520 |
| Size | 2.9 GB | 693.7 MB |
| Events in quadrant A | 13,114,157 | 4,692,730 |
| Events in quadrant B | 44,416,728 | 4,420,995 |
| Events in quadrant C | 13,756,350 | 4,470,896 |
| Events in quadrant D | 18,930,334 | 4,351,753 |
| Mode SS | |||
|---|---|---|---|
| Quadrant | BADHDUFLAG | Total packets | Discarded packets |
| A | 0 | 1220 | 0 |
| B | 0 | 1220 | 0 |
| C | 0 | 1220 | 0 |
| D | 0 | 1220 | 0 |
| Mode M0 | |||
|---|---|---|---|
| Quadrant | BADHDUFLAG | Total packets | Discarded packets |
| A | 0 | 125622 | 0 |
| B | 0 | 243322 | 0 |
| C | 0 | 130472 | 0 |
| D | 0 | 145194 | 0 |
| Mode M9 | |||
|---|---|---|---|
| Quadrant | BADHDUFLAG | Total packets | Discarded packets |
| A | 0 | 88 | 0 |
| B | 0 | 88 | 0 |
| C | 0 | 88 | 0 |
| D | 0 | 88 | 0 |
| Quadrant | Total seconds | Saturated seconds | Saturation percentage |
|---|---|---|---|
| A | 59639 | 725 | 1.215647% |
| B | 59639 | 8954 | 15.013666% |
| C | 59639 | 1332 | 2.233438% |
| D | 59639 | 2223 | 3.727427% |
Noise dominated data is calculated using 1-second bins in cleaned event files. If a bin has >2000 counts, and if more than 50% of those come from <1% of pixels, then it is considered to be noise-dominated and hence unusable.
| Quadrant | # 1 sec bins | Bins with >0 counts | Bins with >2000 counts | High rate bins dominated by noise | Noise dominated (total time) | Noise dominated (detector-on time) | Marked lightcurve |
|---|---|---|---|---|---|---|---|
| A | 68599 | 59641 | 0 | 0 | 0.00% | 0.00% |  |
| B | 68599 | 59644 | 52 | 52 | 0.08% | 0.09% |  |
| C | 68599 | 59642 | 0 | 0 | 0.00% | 0.00% | 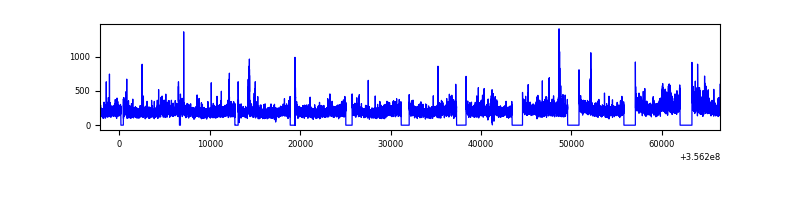 |
| D | 68598 | 59637 | 418 | 418 | 0.61% | 0.70% | 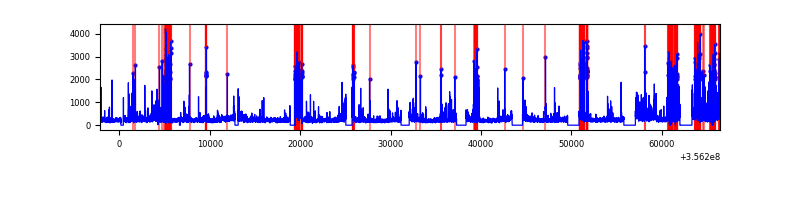 |
Top three noisy pixels from each quadrant. If the there are fewer than three noisy pixels in the level2.evt file, extra rows are filled as -1
| Pixel properties | Quadrant properties | ||||||
|---|---|---|---|---|---|---|---|
| Quadrant | DetID | PixID | Counts | Sigma | Mean | Median | Sigma |
| A | 8 | 192 | 139742 | 191.48 | 3349 | 3294 | 712.6 |
| A | 13 | 254 | 101392 | 137.66 | 3349 | 3294 | 712.6 |
| A | 3 | 1 | 33792 | 42.8 | 3349 | 3294 | 712.6 |
| B | 6 | 36 | 16703848 | 27463.93 | 3214 | 3142 | 608.1 |
| B | 6 | 159 | 15227392 | 25035.93 | 3214 | 3142 | 608.1 |
| B | 0 | 183 | 63621 | 99.46 | 3214 | 3142 | 608.1 |
| C | 3 | 233 | 1381611 | 1863.08 | 3174 | 3164 | 739.9 |
| C | 2 | 114 | 113266 | 148.81 | 3174 | 3164 | 739.9 |
| C | 14 | 254 | 50567 | 64.07 | 3174 | 3164 | 739.9 |
| D | 7 | 80 | 4181673 | 5586.39 | 3187 | 3104 | 748.0 |
| D | 8 | 195 | 1403658 | 1872.42 | 3187 | 3104 | 748.0 |
| D | 11 | 135 | 492682 | 654.52 | 3187 | 3104 | 748.0 |
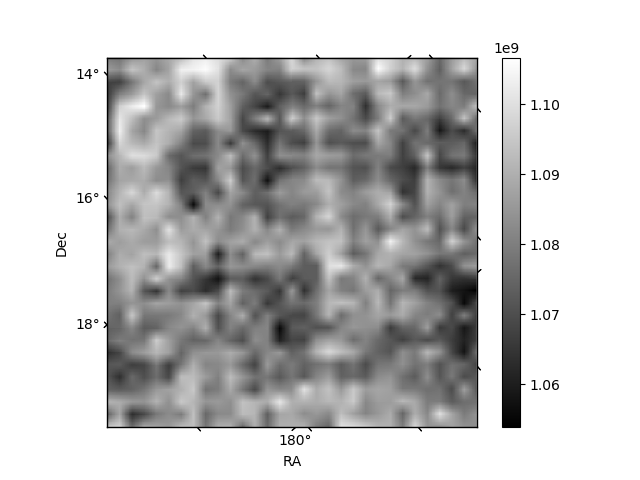
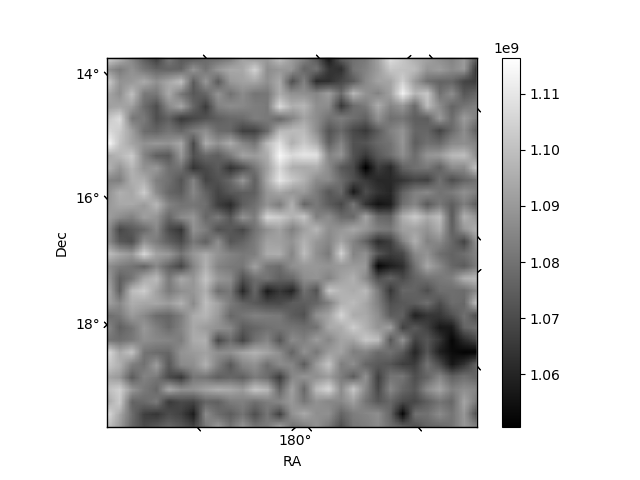
Histogram calculated using DETX and DETY for each event in the final _common_clean file
| Quadrant A |  |
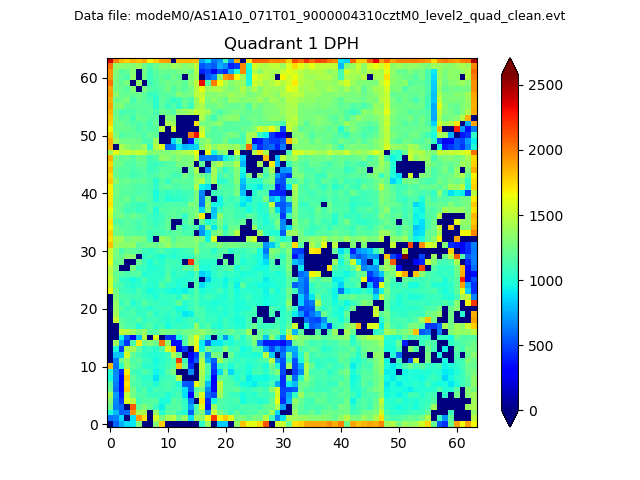 |
Quadrant B |
|---|---|---|---|
| Quadrant D |  |
 |
Quadrant C |
| Plot type | Count rate plots | Images |
|---|---|---|
| Comparison with Poisson distribution Blue bars denote a histogram of data divided into 1 sec bins. Red curve is a Poisson curve with rate = median count rate of data. |
 |
 |
| Quadrant-wise count rates Data is divided into 100 sec bins |
 |
|
| Module-wise count rates for Quadrant A Data is divided into 100 sec bins |
 |
 |
| Module-wise count rates for Quadrant B Data is divided into 100 sec bins |
 |
 |
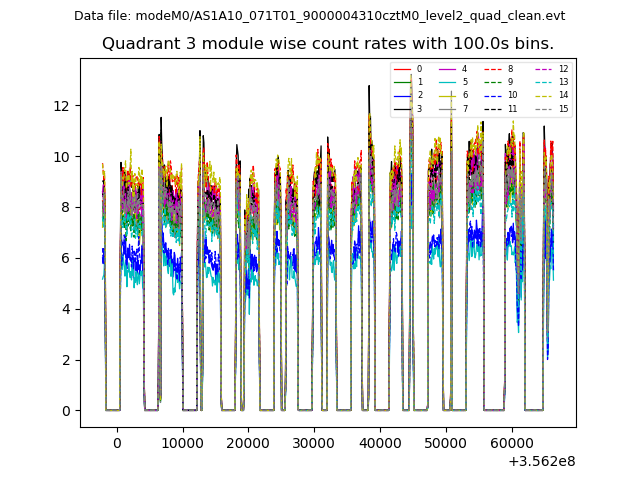
| Module-wise count rates for Quadrant C Data is divided into 100 sec bins |
 |
 |
| Module-wise count rates for Quadrant D Data is divided into 100 sec bins |
 |
 |
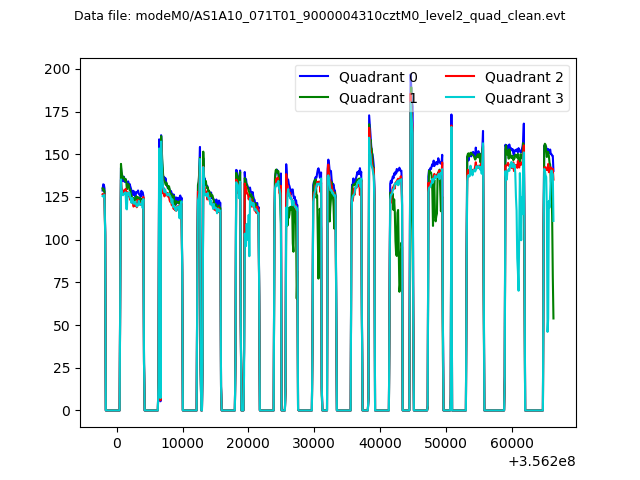
| Parameter | Plot |
|---|---|
| CZT HV Monitor |  |
| D_VDD |  |
| Temperature 1 |  |
| Veto HV Monitor | 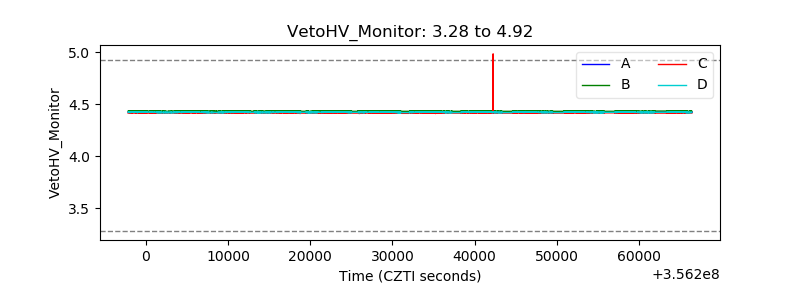 |
| Veto LLD |  |
| Alpha Counter |  |
| _CPM_Rate |  |
| CZT Counter |  |
| +2.5 Volts monitor |  |
| +5 Volts monitor |  |
| _ROLL_ROT | 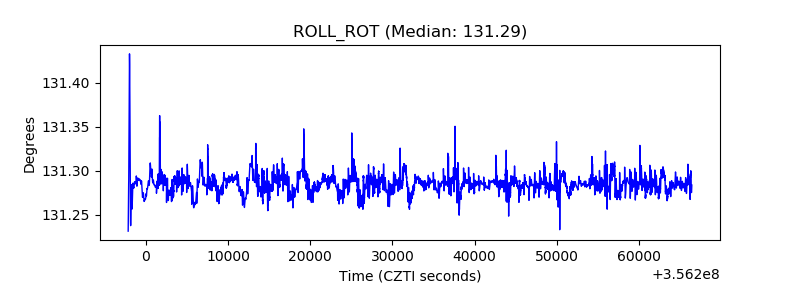 |
| _Roll_DEC | 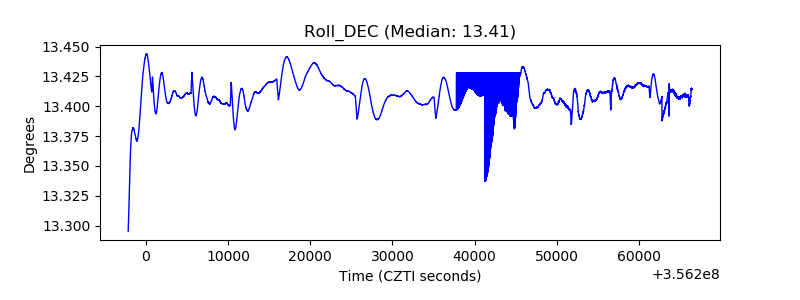 |
| _Roll_RA |  |
| Veto Counter |  |