| Param | Original file | Final file |
|---|---|---|
| Filename | modeM0/AS1A10_071T05_9000004308cztM0_level2_bc.evt | modeM0/AS1A10_071T05_9000004308cztM0_level2_quad_clean.evt |
| Size (bytes) | 2,613,605,760 | 707,109,120 |
| Size | 2.4 GB | 674.4 MB |
| Events in quadrant A | 12,241,031 | 4,613,341 |
| Events in quadrant B | 26,370,257 | 4,583,421 |
| Events in quadrant C | 11,712,262 | 4,394,158 |
| Events in quadrant D | 25,202,937 | 4,166,991 |
| Mode M0 | |||
|---|---|---|---|
| Quadrant | BADHDUFLAG | Total packets | Discarded packets |
| A | 0 | 113503 | 0 |
| B | 0 | 162392 | 0 |
| C | 0 | 113492 | 0 |
| D | 0 | 158176 | 0 |
| Mode SS | |||
|---|---|---|---|
| Quadrant | BADHDUFLAG | Total packets | Discarded packets |
| A | 0 | 1090 | 0 |
| B | 0 | 1090 | 0 |
| C | 0 | 1090 | 0 |
| D | 0 | 1090 | 0 |
| Mode M9 | |||
|---|---|---|---|
| Quadrant | BADHDUFLAG | Total packets | Discarded packets |
| A | 0 | 102 | 0 |
| B | 0 | 102 | 0 |
| C | 0 | 102 | 0 |
| D | 0 | 102 | 0 |
| Quadrant | Total seconds | Saturated seconds | Saturation percentage |
|---|---|---|---|
| A | 53324 | 622 | 1.166454% |
| B | 53324 | 1061 | 1.989723% |
| C | 53324 | 934 | 1.751557% |
| D | 53324 | 4306 | 8.075163% |
Noise dominated data is calculated using 1-second bins in cleaned event files. If a bin has >2000 counts, and if more than 50% of those come from <1% of pixels, then it is considered to be noise-dominated and hence unusable.
| Quadrant | # 1 sec bins | Bins with >0 counts | Bins with >2000 counts | High rate bins dominated by noise | Noise dominated (total time) | Noise dominated (detector-on time) | Marked lightcurve |
|---|---|---|---|---|---|---|---|
| A | 63730 | 53326 | 1 | 1 | 0.00% | 0.00% |  |
| B | 63730 | 53324 | 4 | 4 | 0.01% | 0.01% |  |
| C | 63730 | 53325 | 1 | 1 | 0.00% | 0.00% |  |
| D | 63730 | 53322 | 1208 | 1208 | 1.90% | 2.27% |  |
Top three noisy pixels from each quadrant. If the there are fewer than three noisy pixels in the level2.evt file, extra rows are filled as -1
| Pixel properties | Quadrant properties | ||||||
|---|---|---|---|---|---|---|---|
| Quadrant | DetID | PixID | Counts | Sigma | Mean | Median | Sigma |
| A | 3 | 1 | 140422 | 211.74 | 3078 | 3027 | 648.9 |
| A | 8 | 192 | 120490 | 181.02 | 3078 | 3027 | 648.9 |
| A | 12 | 96 | 114935 | 172.46 | 3078 | 3027 | 648.9 |
| B | 6 | 159 | 14283154 | 24964.78 | 3070 | 3007 | 572.0 |
| B | 6 | 36 | 150381 | 257.64 | 3070 | 3007 | 572.0 |
| B | 0 | 183 | 70358 | 117.74 | 3070 | 3007 | 572.0 |
| C | 3 | 233 | 357204 | 522.26 | 2918 | 2916 | 678.4 |
| C | 2 | 114 | 100936 | 144.49 | 2918 | 2916 | 678.4 |
| C | 10 | 22 | 38975 | 53.16 | 2918 | 2916 | 678.4 |
| D | 7 | 80 | 12596248 | 18350.96 | 2880 | 2809 | 686.3 |
| D | 8 | 195 | 894521 | 1299.39 | 2880 | 2809 | 686.3 |
| D | 2 | 250 | 354482 | 512.45 | 2880 | 2809 | 686.3 |
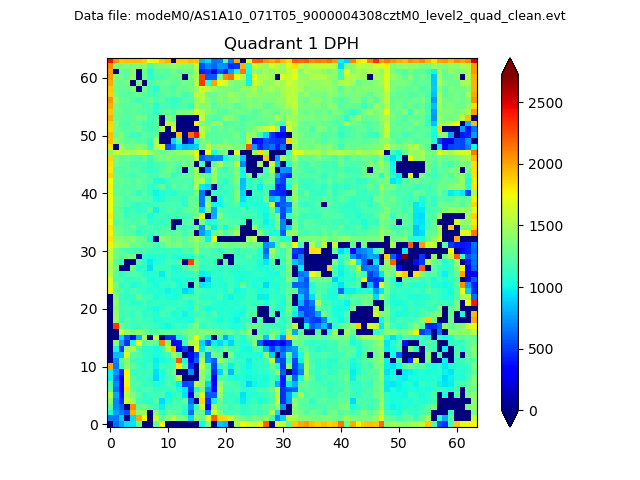
Histogram calculated using DETX and DETY for each event in the final _common_clean file
| Quadrant A |  |
 |
Quadrant B |
|---|---|---|---|
| Quadrant D |  |
 |
Quadrant C |
| Plot type | Count rate plots | Images |
|---|---|---|
| Comparison with Poisson distribution Blue bars denote a histogram of data divided into 1 sec bins. Red curve is a Poisson curve with rate = median count rate of data. |
 |
 |
| Quadrant-wise count rates Data is divided into 100 sec bins |
 |
|
| Module-wise count rates for Quadrant A Data is divided into 100 sec bins |
 |
 |
| Module-wise count rates for Quadrant B Data is divided into 100 sec bins |
 |
 |
| Module-wise count rates for Quadrant C Data is divided into 100 sec bins |
 |
 |
| Module-wise count rates for Quadrant D Data is divided into 100 sec bins |
 |
 |
| Parameter | Plot |
|---|---|
| CZT HV Monitor |  |
| D_VDD | 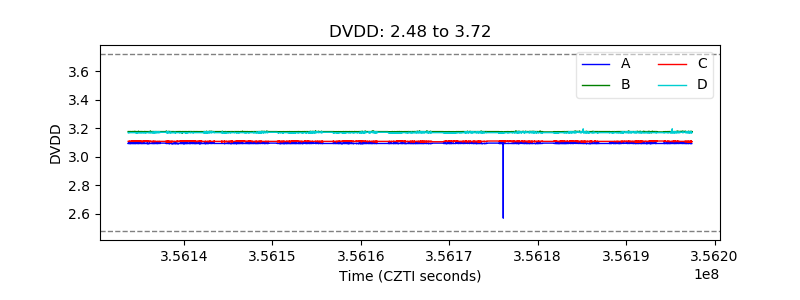 |
| Temperature 1 |  |
| Veto HV Monitor |  |
| Veto LLD |  |
| Alpha Counter |  |
| _CPM_Rate |  |
| CZT Counter |  |
| +2.5 Volts monitor |  |
| +5 Volts monitor |  |
| _ROLL_ROT |  |
| _Roll_DEC |  |
| _Roll_RA |  |
| Veto Counter |  |