| Param | Original file | Final file |
|---|---|---|
| Filename | modeM0/AS1A10_058T01_9000004298cztM0_level2_bc.evt | modeM0/AS1A10_058T01_9000004298cztM0_level2_quad_clean.evt |
| Size (bytes) | 8,476,056,000 | 2,163,827,520 |
| Size | 7.9 GB | 2.0 GB |
| Events in quadrant A | 35,014,547 | 14,305,959 |
| Events in quadrant B | 83,149,599 | 14,019,496 |
| Events in quadrant C | 74,012,343 | 13,198,957 |
| Events in quadrant D | 53,961,813 | 13,349,914 |
| Mode M9 | |||
|---|---|---|---|
| Quadrant | BADHDUFLAG | Total packets | Discarded packets |
| A | 0 | 246 | 0 |
| B | 0 | 246 | 0 |
| C | 0 | 246 | 0 |
| D | 0 | 246 | 0 |
| Mode M0 | |||
|---|---|---|---|
| Quadrant | BADHDUFLAG | Total packets | Discarded packets |
| A | 0 | 327425 | 0 |
| B | 0 | 488642 | 0 |
| C | 0 | 463356 | 0 |
| D | 0 | 385287 | 0 |
| Mode SS | |||
|---|---|---|---|
| Quadrant | BADHDUFLAG | Total packets | Discarded packets |
| A | 0 | 3182 | 0 |
| B | 0 | 3182 | 0 |
| C | 0 | 3182 | 0 |
| D | 0 | 3182 | 0 |
| Quadrant | Total seconds | Saturated seconds | Saturation percentage |
|---|---|---|---|
| A | 155651 | 1995 | 1.281714% |
| B | 155651 | 4968 | 3.191756% |
| C | 155651 | 14664 | 9.421077% |
| D | 155651 | 3946 | 2.535159% |
Noise dominated data is calculated using 1-second bins in cleaned event files. If a bin has >2000 counts, and if more than 50% of those come from <1% of pixels, then it is considered to be noise-dominated and hence unusable.
| Quadrant | # 1 sec bins | Bins with >0 counts | Bins with >2000 counts | High rate bins dominated by noise | Noise dominated (total time) | Noise dominated (detector-on time) | Marked lightcurve |
|---|---|---|---|---|---|---|---|
| A | 180782 | 155657 | 9 | 9 | 0.00% | 0.01% |  |
| B | 180782 | 155656 | 479 | 479 | 0.26% | 0.31% |  |
| C | 180782 | 155650 | 2105 | 2105 | 1.16% | 1.35% |  |
| D | 180782 | 155655 | 519 | 519 | 0.29% | 0.33% |  |
Top three noisy pixels from each quadrant. If the there are fewer than three noisy pixels in the level2.evt file, extra rows are filled as -1
| Pixel properties | Quadrant properties | ||||||
|---|---|---|---|---|---|---|---|
| Quadrant | DetID | PixID | Counts | Sigma | Mean | Median | Sigma |
| A | 12 | 96 | 599915 | 319.0 | 8791 | 8671 | 1853.5 |
| A | 8 | 192 | 340045 | 178.79 | 8791 | 8671 | 1853.5 |
| A | 13 | 254 | 293014 | 153.41 | 8791 | 8671 | 1853.5 |
| B | 6 | 159 | 43562285 | 26974.92 | 8660 | 8495 | 1614.6 |
| B | 6 | 36 | 3829843 | 2366.74 | 8660 | 8495 | 1614.6 |
| B | 3 | 64 | 1417043 | 872.38 | 8660 | 8495 | 1614.6 |
| C | 3 | 233 | 41673312 | 21710.13 | 8146 | 8137 | 1919.2 |
| C | 2 | 114 | 295363 | 149.66 | 8146 | 8137 | 1919.2 |
| C | 15 | 208 | 286164 | 144.87 | 8146 | 8137 | 1919.2 |
| D | 8 | 195 | 9324950 | 4834.43 | 8586 | 8352 | 1927.1 |
| D | 7 | 80 | 5071450 | 2627.27 | 8586 | 8352 | 1927.1 |
| D | 12 | 233 | 2036170 | 1052.25 | 8586 | 8352 | 1927.1 |
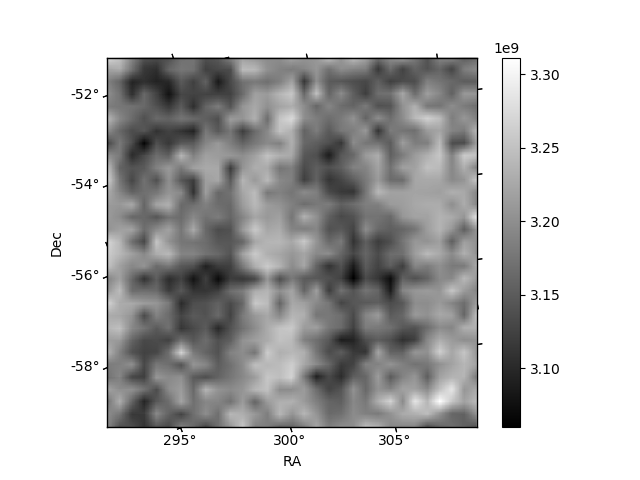
Histogram calculated using DETX and DETY for each event in the final _common_clean file
| Quadrant A |  |
 |
Quadrant B |
|---|---|---|---|
| Quadrant D |  |
 |
Quadrant C |
| Plot type | Count rate plots | Images |
|---|---|---|
| Comparison with Poisson distribution Blue bars denote a histogram of data divided into 1 sec bins. Red curve is a Poisson curve with rate = median count rate of data. |
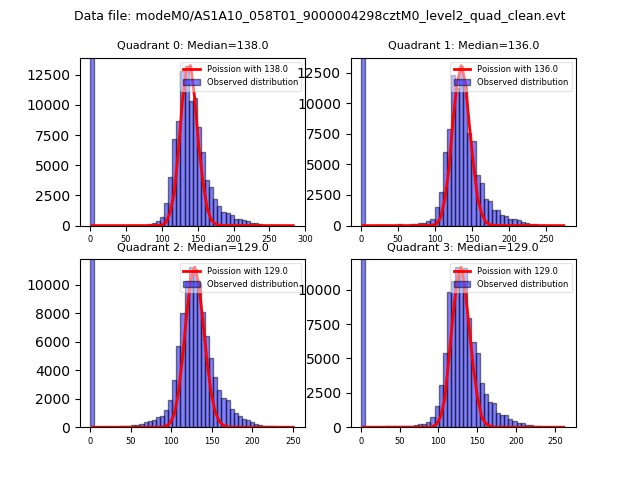 |
 |
| Quadrant-wise count rates Data is divided into 100 sec bins |
 |
|
| Module-wise count rates for Quadrant A Data is divided into 100 sec bins |
 |
 |
| Module-wise count rates for Quadrant B Data is divided into 100 sec bins |
 |
 |
| Module-wise count rates for Quadrant C Data is divided into 100 sec bins |
 |
 |
| Module-wise count rates for Quadrant D Data is divided into 100 sec bins |
 |
 |
| Parameter | Plot |
|---|---|
| CZT HV Monitor |  |
| D_VDD |  |
| Temperature 1 | 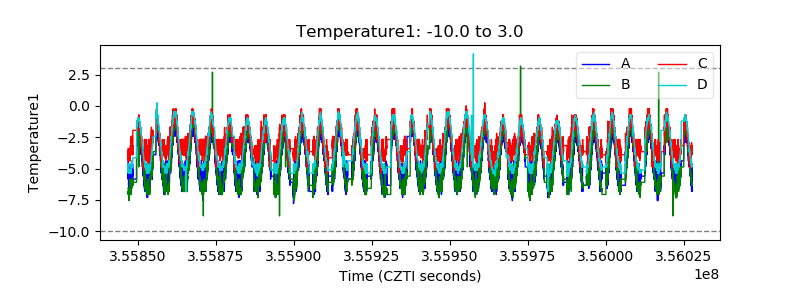 |
| Veto HV Monitor | 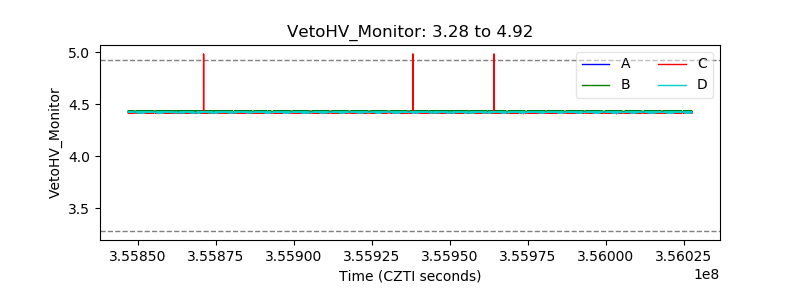 |
| Veto LLD | 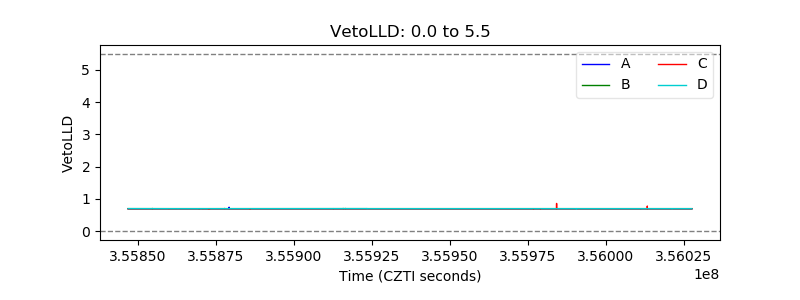 |
| Alpha Counter |  |
| _CPM_Rate |  |
| CZT Counter |  |
| +2.5 Volts monitor | 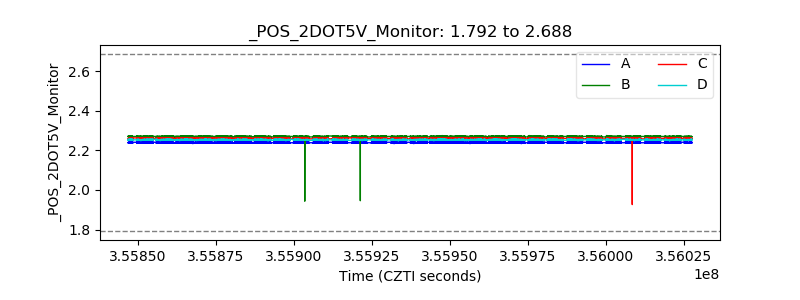 |
| +5 Volts monitor |  |
| _ROLL_ROT |  |
| _Roll_DEC |  |
| _Roll_RA |  |
| Veto Counter | 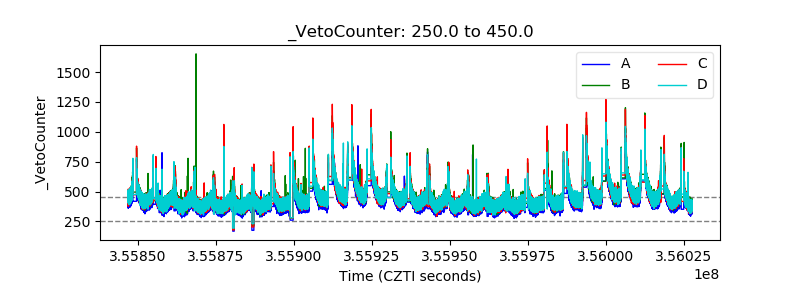 |