| Param | Original file | Final file |
|---|---|---|
| Filename | modeM0/AS1A10_053T05_9000004296cztM0_level2_bc.evt | modeM0/AS1A10_053T05_9000004296cztM0_level2_quad_clean.evt |
| Size (bytes) | 421,859,520 | 103,377,600 |
| Size | 402.3 MB | 98.6 MB |
| Events in quadrant A | 2,031,144 | 676,663 |
| Events in quadrant B | 4,197,219 | 668,684 |
| Events in quadrant C | 3,291,761 | 610,612 |
| Events in quadrant D | 2,708,292 | 621,967 |
| Mode M0 | |||
|---|---|---|---|
| Quadrant | BADHDUFLAG | Total packets | Discarded packets |
| A | 0 | 17431 | 0 |
| B | 0 | 24186 | 0 |
| C | 0 | 23063 | 0 |
| D | 0 | 19500 | 0 |
| Mode SS | |||
|---|---|---|---|
| Quadrant | BADHDUFLAG | Total packets | Discarded packets |
| A | 0 | 162 | 0 |
| B | 0 | 162 | 0 |
| C | 0 | 162 | 0 |
| D | 0 | 162 | 0 |
| Mode M9 | |||
|---|---|---|---|
| Quadrant | BADHDUFLAG | Total packets | Discarded packets |
| A | 0 | 13 | 0 |
| B | 0 | 13 | 0 |
| C | 0 | 13 | 0 |
| D | 0 | 13 | 0 |
| Quadrant | Total seconds | Saturated seconds | Saturation percentage |
|---|---|---|---|
| A | 7947 | 99 | 1.245753% |
| B | 7948 | 152 | 1.912431% |
| C | 7948 | 895 | 11.260695% |
| D | 7948 | 150 | 1.887267% |
Noise dominated data is calculated using 1-second bins in cleaned event files. If a bin has >2000 counts, and if more than 50% of those come from <1% of pixels, then it is considered to be noise-dominated and hence unusable.
| Quadrant | # 1 sec bins | Bins with >0 counts | Bins with >2000 counts | High rate bins dominated by noise | Noise dominated (total time) | Noise dominated (detector-on time) | Marked lightcurve |
|---|---|---|---|---|---|---|---|
| A | 9252 | 7947 | 0 | 0 | 0.00% | 0.00% |  |
| B | 9253 | 7948 | 0 | 0 | 0.00% | 0.00% | 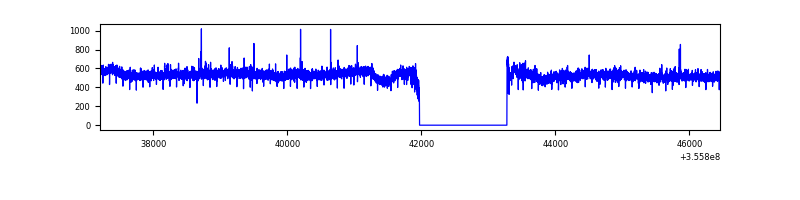 |
| C | 9253 | 7948 | 169 | 169 | 1.83% | 2.13% |  |
| D | 9253 | 7949 | 19 | 19 | 0.21% | 0.24% | 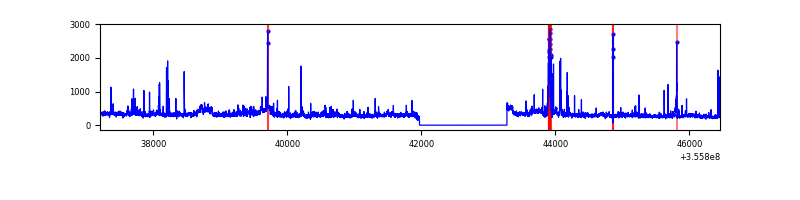 |
Top three noisy pixels from each quadrant. If the there are fewer than three noisy pixels in the level2.evt file, extra rows are filled as -1
| Pixel properties | Quadrant properties | ||||||
|---|---|---|---|---|---|---|---|
| Quadrant | DetID | PixID | Counts | Sigma | Mean | Median | Sigma |
| A | 13 | 254 | 14836 | 129.47 | 521 | 517 | 110.6 |
| A | 8 | 192 | 10678 | 91.88 | 521 | 517 | 110.6 |
| A | 12 | 96 | 9452 | 80.79 | 521 | 517 | 110.6 |
| B | 6 | 159 | 2199863 | 22760.85 | 514 | 506 | 96.6 |
| B | 0 | 214 | 8385 | 81.54 | 514 | 506 | 96.6 |
| B | 4 | 187 | 8077 | 78.35 | 514 | 506 | 96.6 |
| C | 15 | 208 | 1083368 | 10024.04 | 459 | 461 | 108.0 |
| C | 3 | 233 | 379465 | 3508.29 | 459 | 461 | 108.0 |
| C | 14 | 254 | 31110 | 283.71 | 459 | 461 | 108.0 |
| D | 8 | 195 | 464601 | 4118.78 | 500 | 488 | 112.7 |
| D | 2 | 250 | 186898 | 1654.3 | 500 | 488 | 112.7 |
| D | 2 | 234 | 34836 | 304.82 | 500 | 488 | 112.7 |
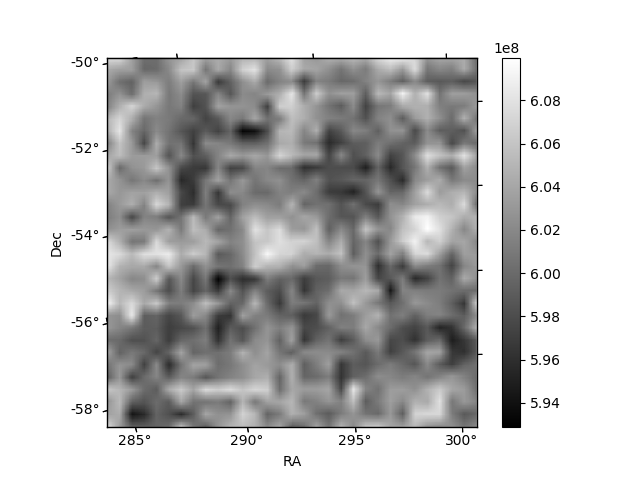
Histogram calculated using DETX and DETY for each event in the final _common_clean file
| Quadrant A |  |
 |
Quadrant B |
|---|---|---|---|
| Quadrant D |  |
 |
Quadrant C |
| Plot type | Count rate plots | Images |
|---|---|---|
| Comparison with Poisson distribution Blue bars denote a histogram of data divided into 1 sec bins. Red curve is a Poisson curve with rate = median count rate of data. |
 |
 |
| Quadrant-wise count rates Data is divided into 100 sec bins |
 |
|
| Module-wise count rates for Quadrant A Data is divided into 100 sec bins |
 |
 |
| Module-wise count rates for Quadrant B Data is divided into 100 sec bins |
 |
 |
| Module-wise count rates for Quadrant C Data is divided into 100 sec bins |
 |
 |
| Module-wise count rates for Quadrant D Data is divided into 100 sec bins |
 |
 |
| Parameter | Plot |
|---|---|
| CZT HV Monitor | 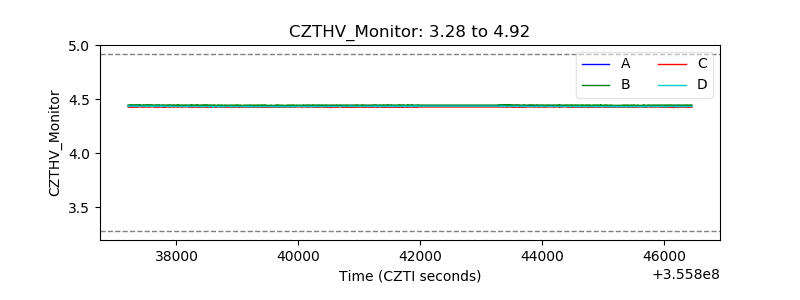 |
| D_VDD |  |
| Temperature 1 | 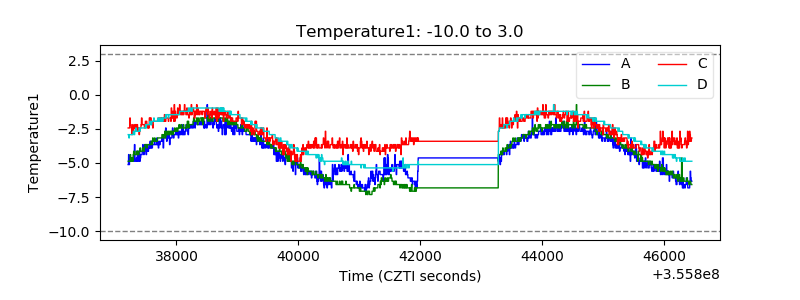 |
| Veto HV Monitor |  |
| Veto LLD |  |
| Alpha Counter |  |
| _CPM_Rate |  |
| CZT Counter |  |
| +2.5 Volts monitor | 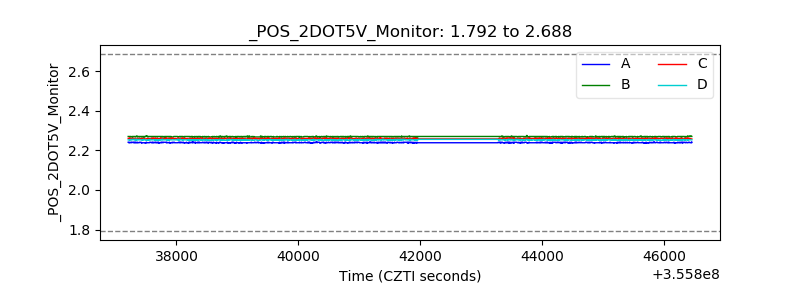 |
| +5 Volts monitor | 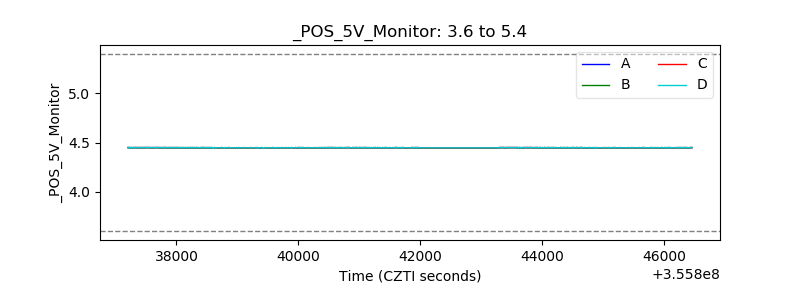 |
| _ROLL_ROT |  |
| _Roll_DEC | 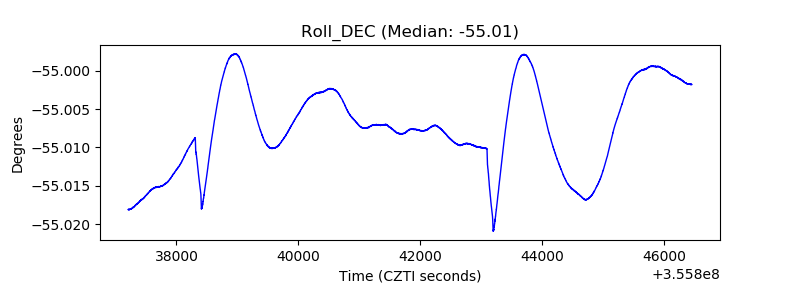 |
| _Roll_RA |  |
| Veto Counter | 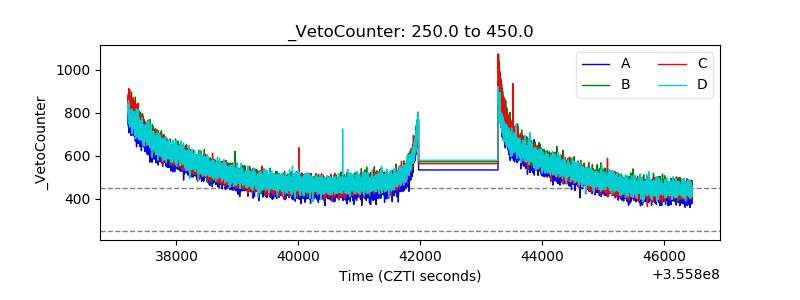 |