| Param | Original file | Final file |
|---|---|---|
| Filename | modeM0/AS1A10_007T01_9000004276cztM0_level2_bc.evt | modeM0/AS1A10_007T01_9000004276cztM0_level2_quad_clean.evt |
| Size (bytes) | 14,945,705,280 | 3,608,645,760 |
| Size | 13.9 GB | 3.4 GB |
| Events in quadrant A | 58,174,042 | 23,201,507 |
| Events in quadrant B | 140,309,136 | 23,351,395 |
| Events in quadrant C | 85,995,102 | 22,640,093 |
| Events in quadrant D | 149,991,774 | 21,755,916 |
| Mode SS | |||
|---|---|---|---|
| Quadrant | BADHDUFLAG | Total packets | Discarded packets |
| A | 0 | 5460 | 0 |
| B | 0 | 5458 | 0 |
| C | 0 | 5458 | 0 |
| D | 0 | 5458 | 0 |
| Mode M0 | |||
|---|---|---|---|
| Quadrant | BADHDUFLAG | Total packets | Discarded packets |
| A | 0 | 564913 | 0 |
| B | 0 | 837677 | 0 |
| C | 0 | 679982 | 0 |
| D | 0 | 863311 | 0 |
| Mode M9 | |||
|---|---|---|---|
| Quadrant | BADHDUFLAG | Total packets | Discarded packets |
| A | 0 | 446 | 0 |
| B | 0 | 446 | 0 |
| C | 0 | 446 | 0 |
| D | 0 | 446 | 0 |
| Quadrant | Total seconds | Saturated seconds | Saturation percentage |
|---|---|---|---|
| A | 268011 | 3007 | 1.121969% |
| B | 267987 | 7656 | 2.856855% |
| C | 268037 | 11812 | 4.406854% |
| D | 268038 | 17774 | 6.631149% |
Noise dominated data is calculated using 1-second bins in cleaned event files. If a bin has >2000 counts, and if more than 50% of those come from <1% of pixels, then it is considered to be noise-dominated and hence unusable.
| Quadrant | # 1 sec bins | Bins with >0 counts | Bins with >2000 counts | High rate bins dominated by noise | Noise dominated (total time) | Noise dominated (detector-on time) | Marked lightcurve |
|---|---|---|---|---|---|---|---|
| A | 329209 | 268079 | 5 | 5 | 0.00% | 0.00% |  |
| B | 329223 | 268023 | 75 | 75 | 0.02% | 0.03% |  |
| C | 329215 | 268104 | 148 | 148 | 0.04% | 0.06% | 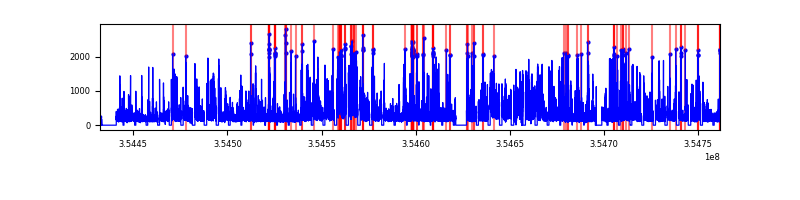 |
| D | 329176 | 268095 | 5417 | 5417 | 1.65% | 2.02% |  |
Top three noisy pixels from each quadrant. If the there are fewer than three noisy pixels in the level2.evt file, extra rows are filled as -1
| Pixel properties | Quadrant properties | ||||||
|---|---|---|---|---|---|---|---|
| Quadrant | DetID | PixID | Counts | Sigma | Mean | Median | Sigma |
| A | 12 | 16 | 662942 | 207.1 | 14793 | 14568 | 3130.7 |
| A | 13 | 254 | 497535 | 154.27 | 14793 | 14568 | 3130.7 |
| A | 12 | 194 | 189534 | 55.89 | 14793 | 14568 | 3130.7 |
| B | 6 | 159 | 76040061 | 27145.75 | 14908 | 14553 | 2800.6 |
| B | 0 | 229 | 3765587 | 1339.35 | 14908 | 14553 | 2800.6 |
| B | 10 | 245 | 1047907 | 368.97 | 14908 | 14553 | 2800.6 |
| C | 3 | 233 | 24758834 | 7355.99 | 14308 | 14281 | 3363.9 |
| C | 10 | 22 | 4145994 | 1228.26 | 14308 | 14281 | 3363.9 |
| C | 7 | 247 | 1061185 | 311.22 | 14308 | 14281 | 3363.9 |
| D | 8 | 195 | 53903067 | 16822.0 | 14258 | 13837 | 3203.5 |
| D | 7 | 80 | 23976717 | 7480.22 | 14258 | 13837 | 3203.5 |
| D | 7 | 223 | 5682003 | 1769.37 | 14258 | 13837 | 3203.5 |
Histogram calculated using DETX and DETY for each event in the final _common_clean file
| Quadrant A |  |
 |
Quadrant B |
|---|---|---|---|
| Quadrant D | 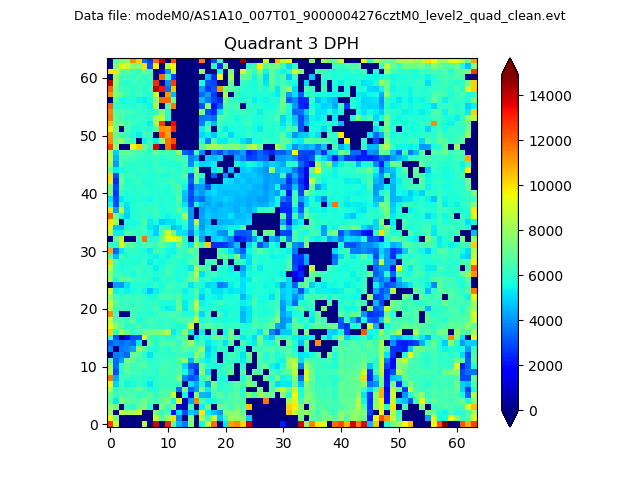 |
 |
Quadrant C |
| Plot type | Count rate plots | Images |
|---|---|---|
| Comparison with Poisson distribution Blue bars denote a histogram of data divided into 1 sec bins. Red curve is a Poisson curve with rate = median count rate of data. |
 |
 |
| Quadrant-wise count rates Data is divided into 100 sec bins |
 |
|
| Module-wise count rates for Quadrant A Data is divided into 100 sec bins |
 |
 |
| Module-wise count rates for Quadrant B Data is divided into 100 sec bins |
 |
 |
| Module-wise count rates for Quadrant C Data is divided into 100 sec bins |
 |
 |
| Module-wise count rates for Quadrant D Data is divided into 100 sec bins |
 |
 |
| Parameter | Plot |
|---|---|
| CZT HV Monitor |  |
| D_VDD |  |
| Temperature 1 |  |
| Veto HV Monitor |  |
| Veto LLD |  |
| Alpha Counter |  |
| _CPM_Rate |  |
| CZT Counter |  |
| +2.5 Volts monitor |  |
| +5 Volts monitor | 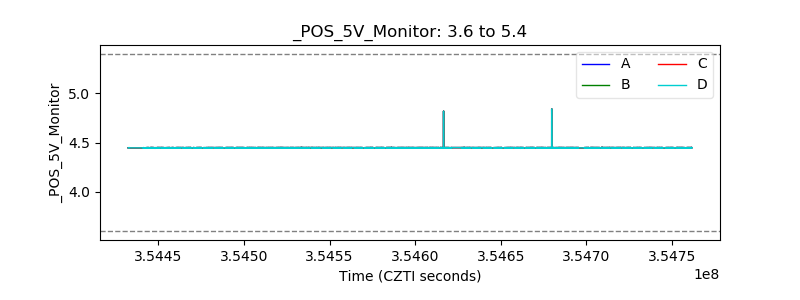 |
| _ROLL_ROT |  |
| _Roll_DEC | 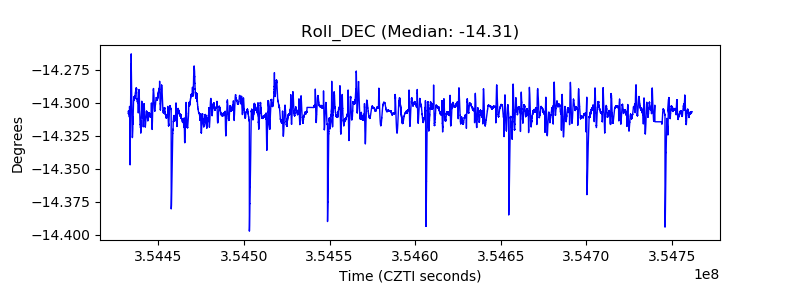 |
| _Roll_RA | 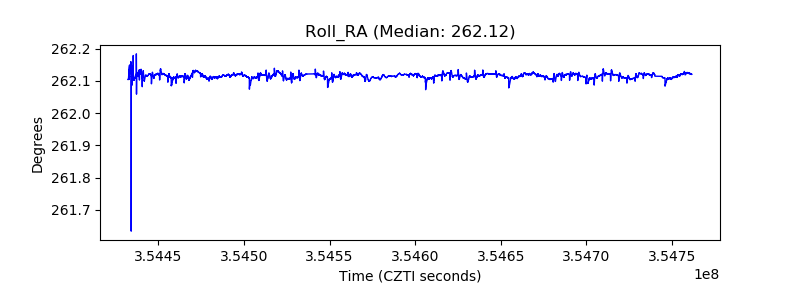 |
| Veto Counter |  |