| Param | Original file | Final file |
|---|---|---|
| Filename | modeM0/AS1A10_093T01_9000004274cztM0_level2_bc.evt | modeM0/AS1A10_093T01_9000004274cztM0_level2_quad_clean.evt |
| Size (bytes) | 4,233,188,160 | 1,183,481,280 |
| Size | 3.9 GB | 1.1 GB |
| Events in quadrant A | 18,695,666 | 7,777,029 |
| Events in quadrant B | 28,913,477 | 7,862,777 |
| Events in quadrant C | 23,765,432 | 7,315,567 |
| Events in quadrant D | 50,816,895 | 6,828,882 |
| Mode SS | |||
|---|---|---|---|
| Quadrant | BADHDUFLAG | Total packets | Discarded packets |
| A | 0 | 1804 | 0 |
| B | 0 | 1806 | 0 |
| C | 0 | 1804 | 0 |
| D | 0 | 1802 | 0 |
| Mode M9 | |||
|---|---|---|---|
| Quadrant | BADHDUFLAG | Total packets | Discarded packets |
| A | 0 | 130 | 0 |
| B | 0 | 130 | 0 |
| C | 0 | 130 | 0 |
| D | 0 | 130 | 0 |
| Mode M0 | |||
|---|---|---|---|
| Quadrant | BADHDUFLAG | Total packets | Discarded packets |
| A | 0 | 183697 | 0 |
| B | 0 | 217058 | 0 |
| C | 0 | 204289 | 0 |
| D | 0 | 293114 | 0 |
| Quadrant | Total seconds | Saturated seconds | Saturation percentage |
|---|---|---|---|
| A | 88455 | 1022 | 1.155390% |
| B | 88390 | 1891 | 2.139382% |
| C | 88389 | 2951 | 3.338651% |
| D | 88390 | 8012 | 9.064374% |
Noise dominated data is calculated using 1-second bins in cleaned event files. If a bin has >2000 counts, and if more than 50% of those come from <1% of pixels, then it is considered to be noise-dominated and hence unusable.
| Quadrant | # 1 sec bins | Bins with >0 counts | Bins with >2000 counts | High rate bins dominated by noise | Noise dominated (total time) | Noise dominated (detector-on time) | Marked lightcurve |
|---|---|---|---|---|---|---|---|
| A | 101752 | 88568 | 10 | 10 | 0.01% | 0.01% |  |
| B | 101751 | 88486 | 60 | 60 | 0.06% | 0.07% |  |
| C | 101752 | 88480 | 21 | 21 | 0.02% | 0.02% |  |
| D | 101752 | 88484 | 2274 | 2274 | 2.23% | 2.57% |  |
Top three noisy pixels from each quadrant. If the there are fewer than three noisy pixels in the level2.evt file, extra rows are filled as -1
| Pixel properties | Quadrant properties | ||||||
|---|---|---|---|---|---|---|---|
| Quadrant | DetID | PixID | Counts | Sigma | Mean | Median | Sigma |
| A | 0 | 13 | 331263 | 318.81 | 4661 | 4563 | 1024.7 |
| A | 12 | 16 | 283986 | 272.68 | 4661 | 4563 | 1024.7 |
| A | 13 | 254 | 168862 | 160.33 | 4661 | 4563 | 1024.7 |
| B | 6 | 159 | 7655847 | 8445.7 | 4716 | 4599 | 905.9 |
| B | 0 | 229 | 1999681 | 2202.24 | 4716 | 4599 | 905.9 |
| B | 10 | 245 | 402089 | 438.76 | 4716 | 4599 | 905.9 |
| C | 3 | 233 | 5091648 | 4796.17 | 4462 | 4445 | 1060.7 |
| C | 10 | 22 | 786781 | 737.58 | 4462 | 4445 | 1060.7 |
| C | 7 | 247 | 195406 | 180.04 | 4462 | 4445 | 1060.7 |
| D | 7 | 80 | 19396567 | 19199.16 | 4386 | 4239 | 1010.1 |
| D | 8 | 195 | 7033382 | 6959.13 | 4386 | 4239 | 1010.1 |
| D | 7 | 238 | 2775464 | 2743.62 | 4386 | 4239 | 1010.1 |
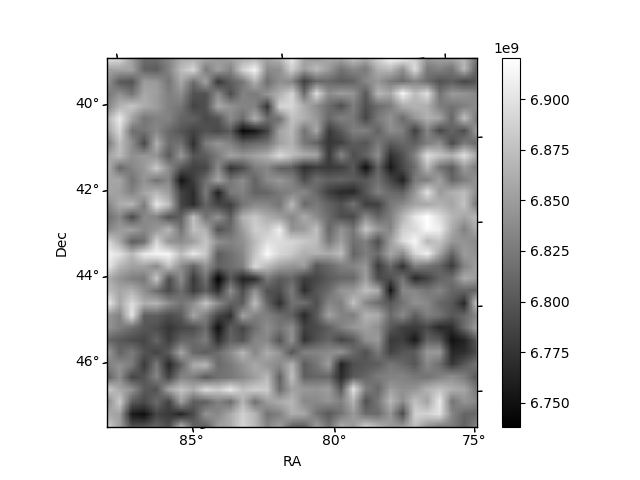
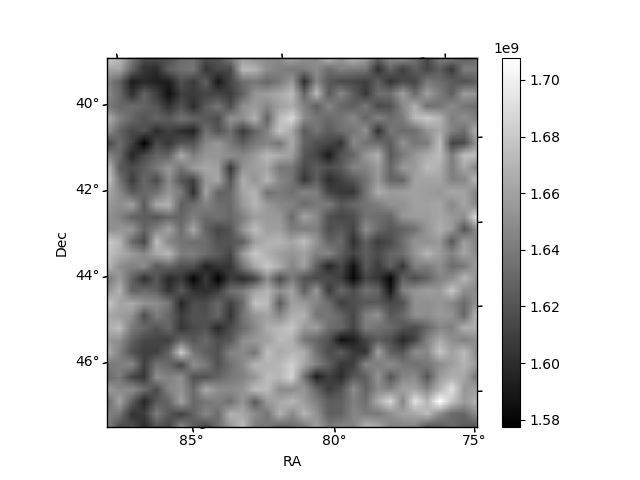
Histogram calculated using DETX and DETY for each event in the final _common_clean file
| Quadrant A |  |
 |
Quadrant B |
|---|---|---|---|
| Quadrant D |  |
 |
Quadrant C |
| Plot type | Count rate plots | Images |
|---|---|---|
| Comparison with Poisson distribution Blue bars denote a histogram of data divided into 1 sec bins. Red curve is a Poisson curve with rate = median count rate of data. |
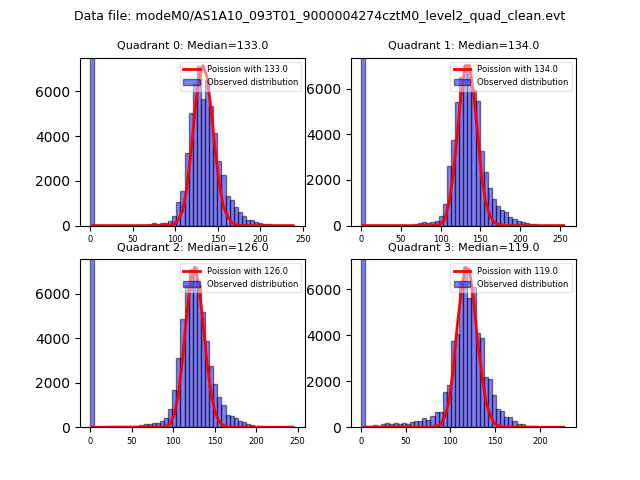 |
 |
| Quadrant-wise count rates Data is divided into 100 sec bins |
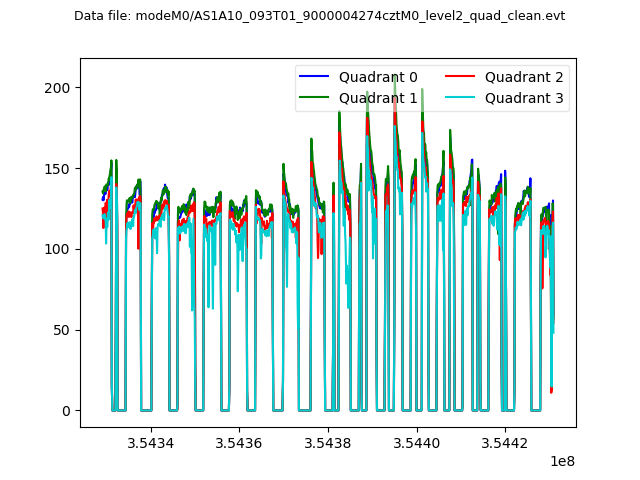 |
|
| Module-wise count rates for Quadrant A Data is divided into 100 sec bins |
 |
 |
| Module-wise count rates for Quadrant B Data is divided into 100 sec bins |
 |
 |
| Module-wise count rates for Quadrant C Data is divided into 100 sec bins |
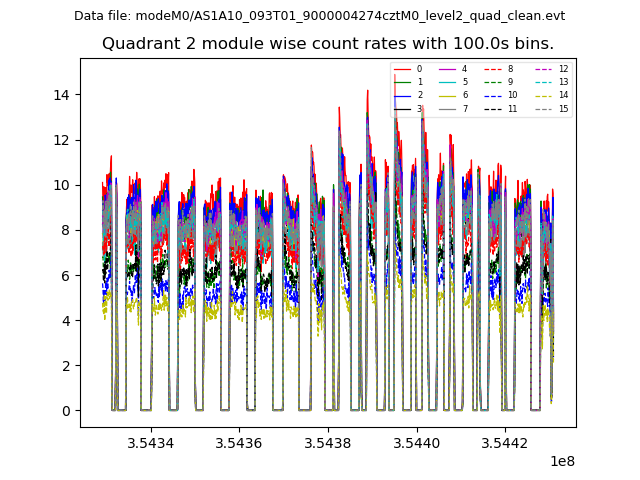 |
 |
| Module-wise count rates for Quadrant D Data is divided into 100 sec bins |
 |
 |
| Parameter | Plot |
|---|---|
| CZT HV Monitor |  |
| D_VDD | 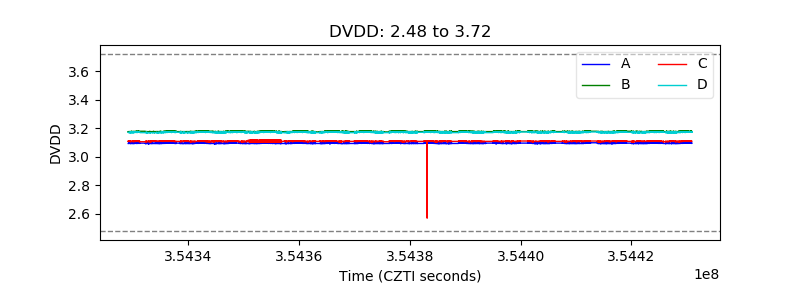 |
| Temperature 1 |  |
| Veto HV Monitor | 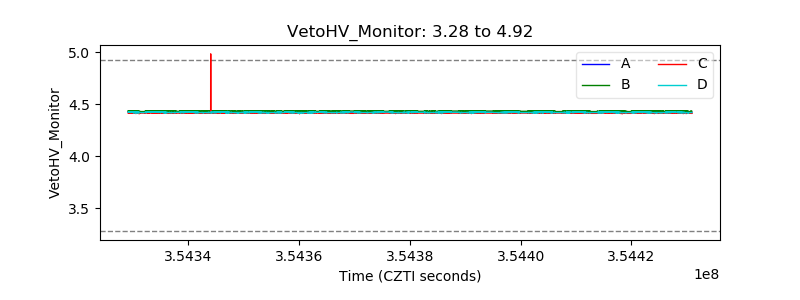 |
| Veto LLD |  |
| Alpha Counter | 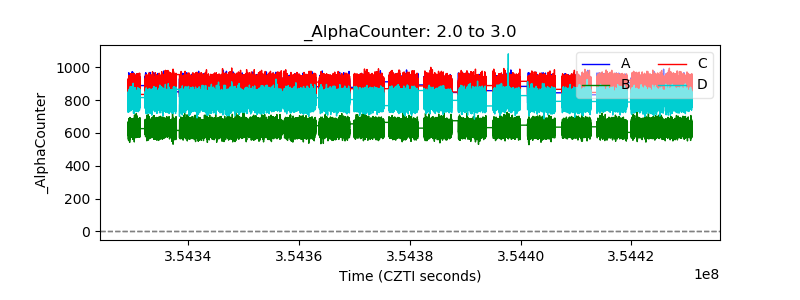 |
| _CPM_Rate | 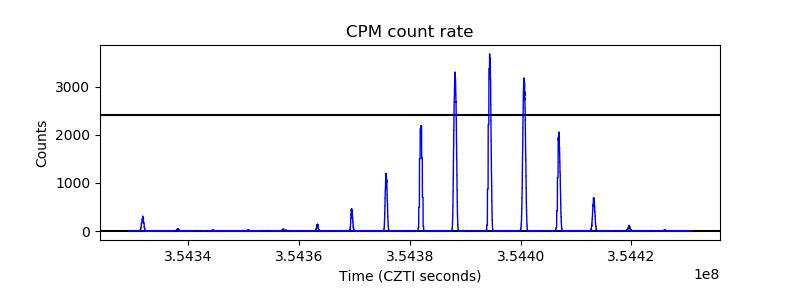 |
| CZT Counter |  |
| +2.5 Volts monitor |  |
| +5 Volts monitor |  |
| _ROLL_ROT |  |
| _Roll_DEC |  |
| _Roll_RA |  |
| Veto Counter |  |