| Param | Original file | Final file |
|---|---|---|
| Filename | modeM0/AS1A10_097T02_9000004272cztM0_level2_bc.evt | modeM0/AS1A10_097T02_9000004272cztM0_level2_quad_clean.evt |
| Size (bytes) | 1,939,720,320 | 582,402,240 |
| Size | 1.8 GB | 555.4 MB |
| Events in quadrant A | 9,410,885 | 3,805,761 |
| Events in quadrant B | 10,997,219 | 3,854,369 |
| Events in quadrant C | 10,107,446 | 3,640,194 |
| Events in quadrant D | 25,249,988 | 3,339,096 |
| Mode M0 | |||
|---|---|---|---|
| Quadrant | BADHDUFLAG | Total packets | Discarded packets |
| A | 0 | 91610 | 0 |
| B | 0 | 96812 | 0 |
| C | 0 | 95931 | 0 |
| D | 0 | 149144 | 0 |
| Mode SS | |||
|---|---|---|---|
| Quadrant | BADHDUFLAG | Total packets | Discarded packets |
| A | 0 | 890 | 0 |
| B | 0 | 890 | 0 |
| C | 0 | 890 | 0 |
| D | 0 | 890 | 0 |
| Mode M9 | |||
|---|---|---|---|
| Quadrant | BADHDUFLAG | Total packets | Discarded packets |
| A | 0 | 93 | 0 |
| B | 0 | 93 | 0 |
| C | 0 | 93 | 0 |
| D | 0 | 93 | 0 |
| Quadrant | Total seconds | Saturated seconds | Saturation percentage |
|---|---|---|---|
| A | 43716 | 485 | 1.109434% |
| B | 43716 | 672 | 1.537195% |
| C | 43716 | 1098 | 2.511666% |
| D | 43716 | 5125 | 11.723396% |
Noise dominated data is calculated using 1-second bins in cleaned event files. If a bin has >2000 counts, and if more than 50% of those come from <1% of pixels, then it is considered to be noise-dominated and hence unusable.
| Quadrant | # 1 sec bins | Bins with >0 counts | Bins with >2000 counts | High rate bins dominated by noise | Noise dominated (total time) | Noise dominated (detector-on time) | Marked lightcurve |
|---|---|---|---|---|---|---|---|
| A | 52921 | 43711 | 0 | 0 | 0.00% | 0.00% |  |
| B | 52921 | 43709 | 4 | 4 | 0.01% | 0.01% |  |
| C | 52921 | 43711 | 6 | 6 | 0.01% | 0.01% |  |
| D | 52921 | 43708 | 1605 | 1605 | 3.03% | 3.67% |  |
Top three noisy pixels from each quadrant. If the there are fewer than three noisy pixels in the level2.evt file, extra rows are filled as -1
| Pixel properties | Quadrant properties | ||||||
|---|---|---|---|---|---|---|---|
| Quadrant | DetID | PixID | Counts | Sigma | Mean | Median | Sigma |
| A | 13 | 254 | 76383 | 141.65 | 2425 | 2381 | 522.4 |
| A | 0 | 13 | 45984 | 83.46 | 2425 | 2381 | 522.4 |
| A | 0 | 226 | 15275 | 24.68 | 2425 | 2381 | 522.4 |
| B | 0 | 189 | 850502 | 1846.5 | 2447 | 2389 | 459.3 |
| B | 0 | 229 | 588534 | 1276.14 | 2447 | 2389 | 459.3 |
| B | 0 | 190 | 92477 | 196.14 | 2447 | 2389 | 459.3 |
| C | 3 | 233 | 550993 | 1012.66 | 2309 | 2299 | 541.8 |
| C | 10 | 22 | 472566 | 867.91 | 2309 | 2299 | 541.8 |
| C | 2 | 114 | 85164 | 152.93 | 2309 | 2299 | 541.8 |
| D | 7 | 80 | 12867437 | 25302.68 | 2224 | 2153 | 508.5 |
| D | 8 | 195 | 2554950 | 5020.69 | 2224 | 2153 | 508.5 |
| D | 2 | 250 | 486505 | 952.59 | 2224 | 2153 | 508.5 |
Histogram calculated using DETX and DETY for each event in the final _common_clean file
| Quadrant A |  |
 |
Quadrant B |
|---|---|---|---|
| Quadrant D |  |
 |
Quadrant C |
| Plot type | Count rate plots | Images |
|---|---|---|
| Comparison with Poisson distribution Blue bars denote a histogram of data divided into 1 sec bins. Red curve is a Poisson curve with rate = median count rate of data. |
 |
 |
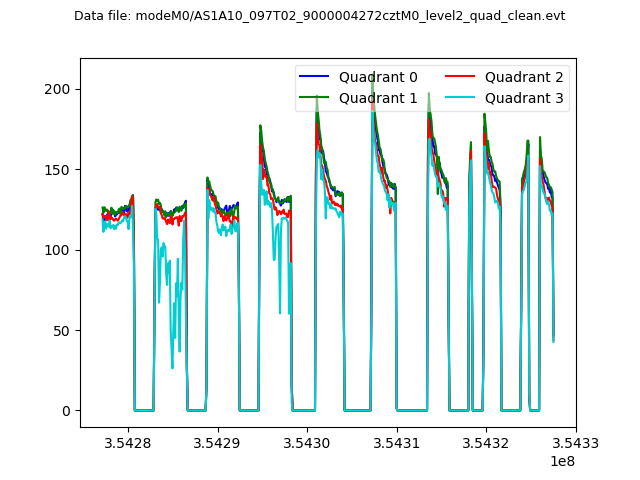
| Quadrant-wise count rates Data is divided into 100 sec bins |
 |
|
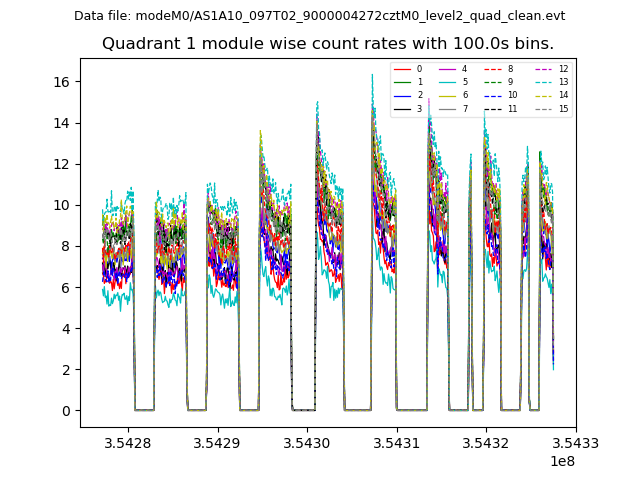
| Module-wise count rates for Quadrant A Data is divided into 100 sec bins |
 |
 |
| Module-wise count rates for Quadrant B Data is divided into 100 sec bins |
 |
 |
| Module-wise count rates for Quadrant C Data is divided into 100 sec bins |
 |
 |
| Module-wise count rates for Quadrant D Data is divided into 100 sec bins |
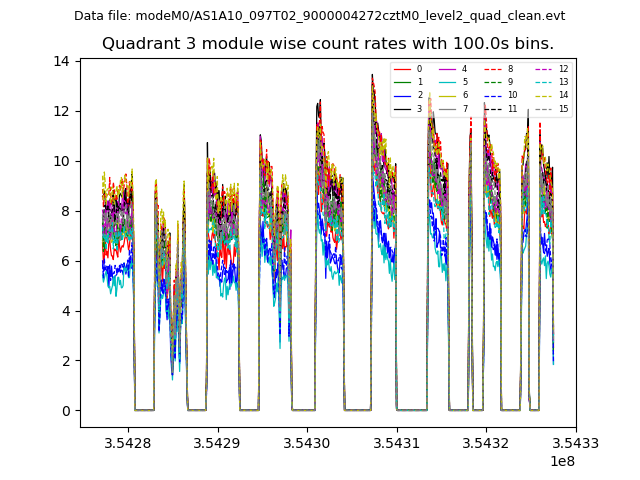 |
 |
| Parameter | Plot |
|---|---|
| CZT HV Monitor |  |
| D_VDD | 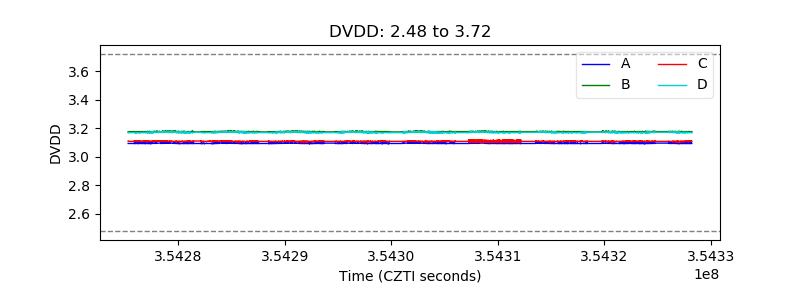 |
| Temperature 1 |  |
| Veto HV Monitor | 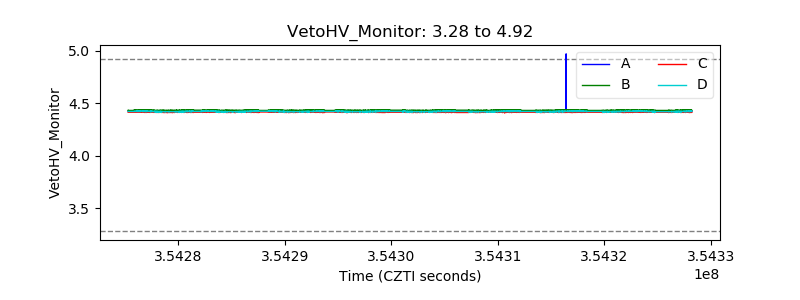 |
| Veto LLD |  |
| Alpha Counter |  |
| _CPM_Rate |  |
| CZT Counter | 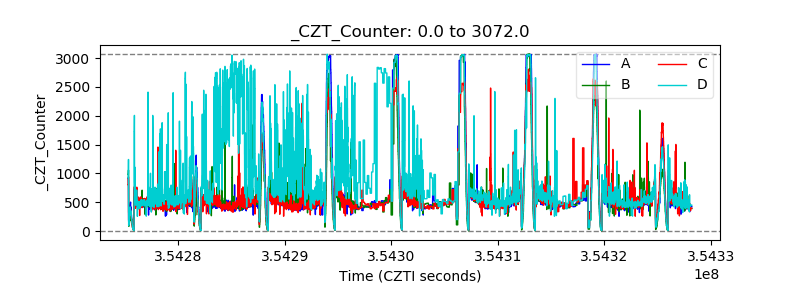 |
| +2.5 Volts monitor |  |
| +5 Volts monitor |  |
| _ROLL_ROT |  |
| _Roll_DEC |  |
| _Roll_RA |  |
| Veto Counter |  |