| Param | Original file | Final file |
|---|---|---|
| Filename | modeM0/AS1C05_019T01_9000004270cztM0_level2_bc.evt | modeM0/AS1C05_019T01_9000004270cztM0_level2_quad_clean.evt |
| Size (bytes) | 4,826,093,760 | 1,613,554,560 |
| Size | 4.5 GB | 1.5 GB |
| Events in quadrant A | 22,452,243 | 10,650,912 |
| Events in quadrant B | 24,856,560 | 10,945,427 |
| Events in quadrant C | 22,803,487 | 10,600,082 |
| Events in quadrant D | 69,001,316 | 9,577,838 |
| Mode M9 | |||
|---|---|---|---|
| Quadrant | BADHDUFLAG | Total packets | Discarded packets |
| A | 0 | 147 | 0 |
| B | 0 | 147 | 0 |
| C | 0 | 147 | 0 |
| D | 0 | 147 | 0 |
| Mode SS | |||
|---|---|---|---|
| Quadrant | BADHDUFLAG | Total packets | Discarded packets |
| A | 0 | 2108 | 0 |
| B | 0 | 2108 | 0 |
| C | 0 | 2108 | 0 |
| D | 0 | 2108 | 0 |
| Mode M0 | |||
|---|---|---|---|
| Quadrant | BADHDUFLAG | Total packets | Discarded packets |
| A | 0 | 217509 | 0 |
| B | 0 | 225092 | 0 |
| C | 0 | 220557 | 0 |
| D | 0 | 377856 | 0 |
| Quadrant | Total seconds | Saturated seconds | Saturation percentage |
|---|---|---|---|
| A | 103580 | 1414 | 1.365128% |
| B | 103580 | 1769 | 1.707859% |
| C | 103580 | 1982 | 1.913497% |
| D | 103580 | 14117 | 13.629079% |
Noise dominated data is calculated using 1-second bins in cleaned event files. If a bin has >2000 counts, and if more than 50% of those come from <1% of pixels, then it is considered to be noise-dominated and hence unusable.
| Quadrant | # 1 sec bins | Bins with >0 counts | Bins with >2000 counts | High rate bins dominated by noise | Noise dominated (total time) | Noise dominated (detector-on time) | Marked lightcurve |
|---|---|---|---|---|---|---|---|
| A | 117274 | 103574 | 278 | 278 | 0.24% | 0.27% |  |
| B | 117274 | 103570 | 75 | 75 | 0.06% | 0.07% |  |
| C | 117274 | 103573 | 24 | 24 | 0.02% | 0.02% |  |
| D | 117274 | 103574 | 3864 | 3864 | 3.29% | 3.73% |  |
Top three noisy pixels from each quadrant. If the there are fewer than three noisy pixels in the level2.evt file, extra rows are filled as -1
| Pixel properties | Quadrant properties | ||||||
|---|---|---|---|---|---|---|---|
| Quadrant | DetID | PixID | Counts | Sigma | Mean | Median | Sigma |
| A | 0 | 13 | 1383388 | 1179.8 | 5406 | 5315 | 1168.1 |
| A | 13 | 254 | 180409 | 149.9 | 5406 | 5315 | 1168.1 |
| A | 12 | 96 | 134499 | 110.6 | 5406 | 5315 | 1168.1 |
| B | 10 | 245 | 1584863 | 1520.9 | 5515 | 5384 | 1038.5 |
| B | 0 | 229 | 1330586 | 1276.05 | 5515 | 5384 | 1038.5 |
| B | 0 | 189 | 186609 | 174.5 | 5515 | 5384 | 1038.5 |
| C | 3 | 233 | 1328498 | 1049.64 | 5322 | 5297 | 1260.6 |
| C | 10 | 22 | 422834 | 331.22 | 5322 | 5297 | 1260.6 |
| C | 7 | 247 | 256728 | 199.45 | 5322 | 5297 | 1260.6 |
| D | 7 | 80 | 34366118 | 29340.77 | 5056 | 4888 | 1171.1 |
| D | 8 | 195 | 7666966 | 6542.58 | 5056 | 4888 | 1171.1 |
| D | 7 | 238 | 4163367 | 3550.89 | 5056 | 4888 | 1171.1 |
Histogram calculated using DETX and DETY for each event in the final _common_clean file
| Quadrant A |  |
 |
Quadrant B |
|---|---|---|---|
| Quadrant D |  |
 |
Quadrant C |
| Plot type | Count rate plots | Images |
|---|---|---|
| Comparison with Poisson distribution Blue bars denote a histogram of data divided into 1 sec bins. Red curve is a Poisson curve with rate = median count rate of data. |
 |
 |
| Quadrant-wise count rates Data is divided into 100 sec bins |
 |
|
| Module-wise count rates for Quadrant A Data is divided into 100 sec bins |
 |
 |
| Module-wise count rates for Quadrant B Data is divided into 100 sec bins |
 |
 |
| Module-wise count rates for Quadrant C Data is divided into 100 sec bins |
 |
 |
| Module-wise count rates for Quadrant D Data is divided into 100 sec bins |
 |
 |
| Parameter | Plot |
|---|---|
| CZT HV Monitor |  |
| D_VDD | 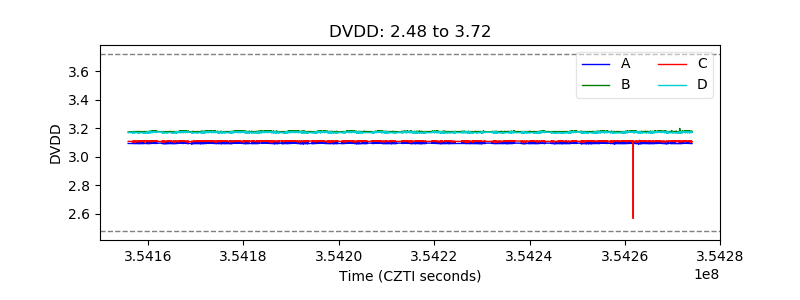 |
| Temperature 1 | 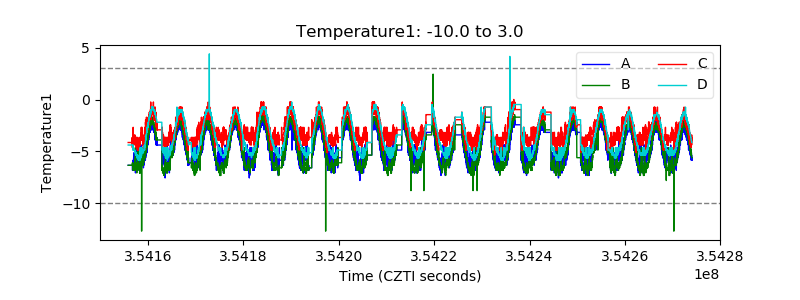 |
| Veto HV Monitor | 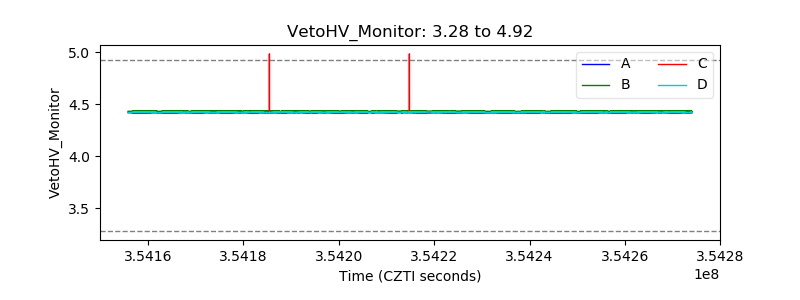 |
| Veto LLD |  |
| Alpha Counter |  |
| _CPM_Rate |  |
| CZT Counter |  |
| +2.5 Volts monitor |  |
| +5 Volts monitor |  |
| _ROLL_ROT |  |
| _Roll_DEC |  |
| _Roll_RA |  |
| Veto Counter |  |