| Param | Original file | Final file |
|---|---|---|
| Filename | modeM0/AS1T03_286T01_9000004268cztM0_level2_bc.evt | modeM0/AS1T03_286T01_9000004268cztM0_level2_quad_clean.evt |
| Size (bytes) | 10,289,874,240 | 4,008,784,320 |
| Size | 9.6 GB | 3.7 GB |
| Events in quadrant A | 55,368,978 | 26,204,261 |
| Events in quadrant B | 57,478,240 | 26,865,115 |
| Events in quadrant C | 57,208,382 | 25,853,950 |
| Events in quadrant D | 123,502,573 | 24,316,394 |
| Mode M9 | |||
|---|---|---|---|
| Quadrant | BADHDUFLAG | Total packets | Discarded packets |
| A | 0 | 419 | 0 |
| B | 0 | 419 | 0 |
| C | 0 | 419 | 0 |
| D | 0 | 419 | 0 |
| Mode SS | |||
|---|---|---|---|
| Quadrant | BADHDUFLAG | Total packets | Discarded packets |
| A | 0 | 5410 | 0 |
| B | 0 | 5410 | 0 |
| C | 0 | 5410 | 0 |
| D | 0 | 5410 | 0 |
| Mode M0 | |||
|---|---|---|---|
| Quadrant | BADHDUFLAG | Total packets | Discarded packets |
| A | 0 | 549257 | 0 |
| B | 0 | 555652 | 0 |
| C | 0 | 565966 | 0 |
| D | 0 | 778694 | 0 |
| Quadrant | Total seconds | Saturated seconds | Saturation percentage |
|---|---|---|---|
| A | 265572 | 2908 | 1.094995% |
| B | 265572 | 3944 | 1.485096% |
| C | 265572 | 7957 | 2.996174% |
| D | 265572 | 17427 | 6.562062% |
Noise dominated data is calculated using 1-second bins in cleaned event files. If a bin has >2000 counts, and if more than 50% of those come from <1% of pixels, then it is considered to be noise-dominated and hence unusable.
| Quadrant | # 1 sec bins | Bins with >0 counts | Bins with >2000 counts | High rate bins dominated by noise | Noise dominated (total time) | Noise dominated (detector-on time) | Marked lightcurve |
|---|---|---|---|---|---|---|---|
| A | 307508 | 265563 | 23 | 23 | 0.01% | 0.01% |  |
| B | 307508 | 265549 | 58 | 58 | 0.02% | 0.02% |  |
| C | 307508 | 265554 | 16 | 16 | 0.01% | 0.01% |  |
| D | 307508 | 265555 | 3390 | 3390 | 1.10% | 1.28% |  |
Top three noisy pixels from each quadrant. If the there are fewer than three noisy pixels in the level2.evt file, extra rows are filled as -1
| Pixel properties | Quadrant properties | ||||||
|---|---|---|---|---|---|---|---|
| Quadrant | DetID | PixID | Counts | Sigma | Mean | Median | Sigma |
| A | 12 | 96 | 908841 | 297.97 | 13989 | 13769 | 3003.9 |
| A | 13 | 254 | 449749 | 145.14 | 13989 | 13769 | 3003.9 |
| A | 0 | 13 | 256815 | 80.91 | 13989 | 13769 | 3003.9 |
| B | 0 | 189 | 554407 | 201.08 | 14293 | 13974 | 2687.7 |
| B | 15 | 33 | 546893 | 198.28 | 14293 | 13974 | 2687.7 |
| B | 0 | 229 | 542884 | 196.79 | 14293 | 13974 | 2687.7 |
| C | 10 | 22 | 1476061 | 448.1 | 13698 | 13664 | 3263.5 |
| C | 3 | 233 | 1473594 | 447.35 | 13698 | 13664 | 3263.5 |
| C | 14 | 254 | 562799 | 168.26 | 13698 | 13664 | 3263.5 |
| D | 7 | 80 | 21455825 | 6928.32 | 13508 | 13084 | 3094.9 |
| D | 7 | 238 | 18440471 | 5954.03 | 13508 | 13084 | 3094.9 |
| D | 8 | 195 | 14977788 | 4835.21 | 13508 | 13084 | 3094.9 |
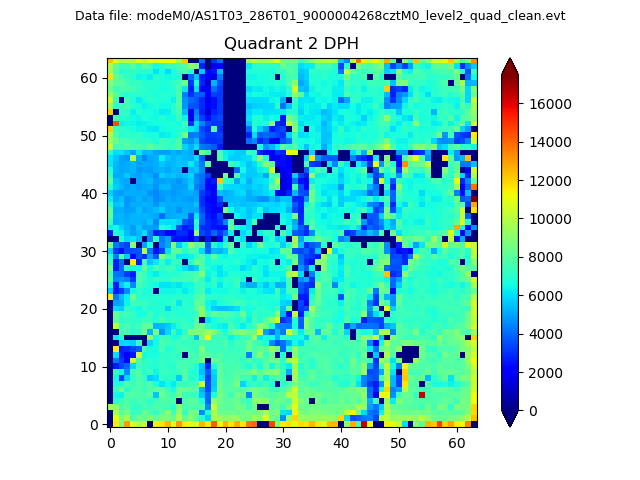
Histogram calculated using DETX and DETY for each event in the final _common_clean file
| Quadrant A |  |
 |
Quadrant B |
|---|---|---|---|
| Quadrant D |  |
 |
Quadrant C |
| Plot type | Count rate plots | Images |
|---|---|---|
| Comparison with Poisson distribution Blue bars denote a histogram of data divided into 1 sec bins. Red curve is a Poisson curve with rate = median count rate of data. |
 |
 |
| Quadrant-wise count rates Data is divided into 100 sec bins |
 |
|
| Module-wise count rates for Quadrant A Data is divided into 100 sec bins |
 |
 |
| Module-wise count rates for Quadrant B Data is divided into 100 sec bins |
 |
 |
| Module-wise count rates for Quadrant C Data is divided into 100 sec bins |
 |
 |
| Module-wise count rates for Quadrant D Data is divided into 100 sec bins |
 |
 |
| Parameter | Plot |
|---|---|
| CZT HV Monitor |  |
| D_VDD |  |
| Temperature 1 | 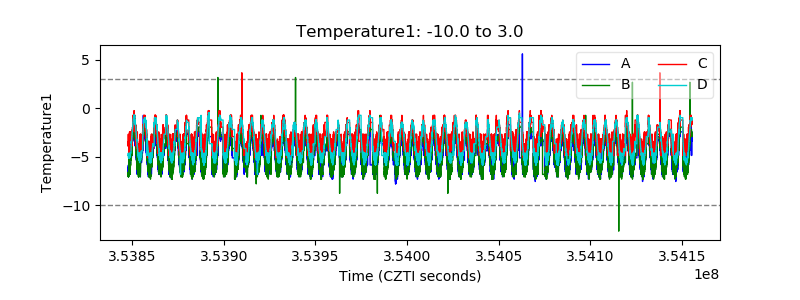 |
| Veto HV Monitor | 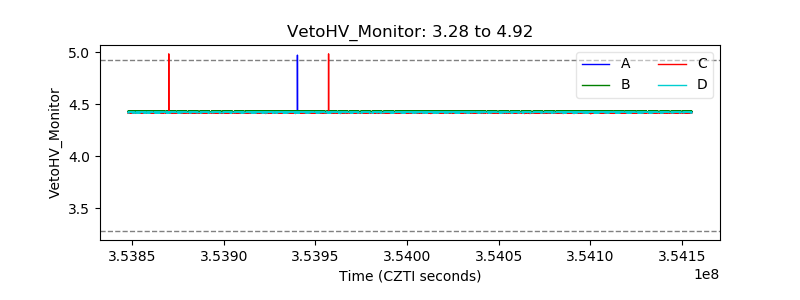 |
| Veto LLD |  |
| Alpha Counter |  |
| _CPM_Rate | 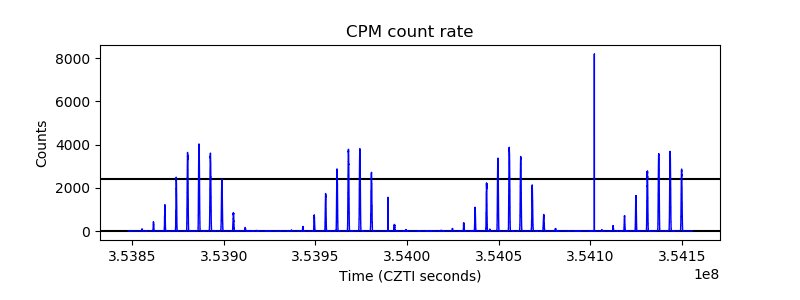 |
| CZT Counter | 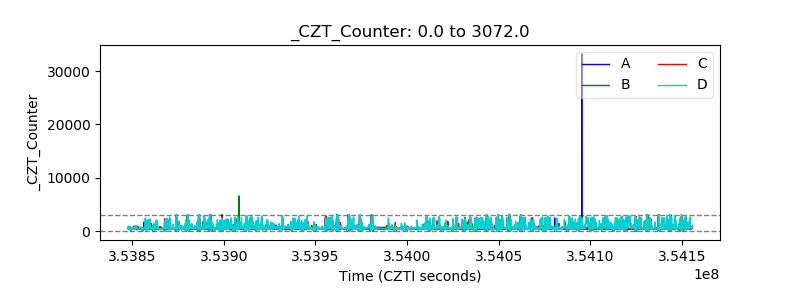 |
| +2.5 Volts monitor | 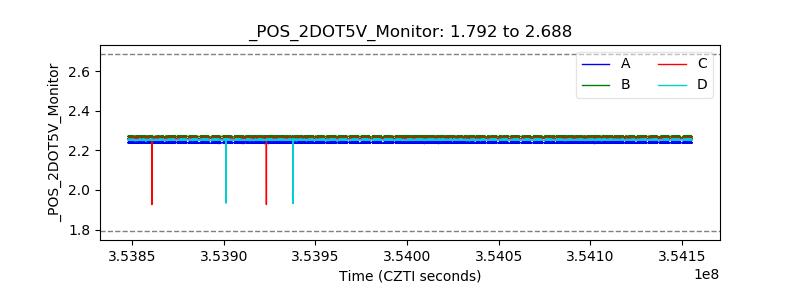 |
| +5 Volts monitor |  |
| _ROLL_ROT |  |
| _Roll_DEC | 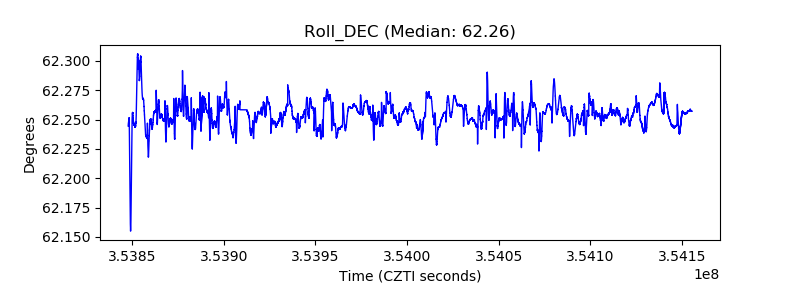 |
| _Roll_RA | 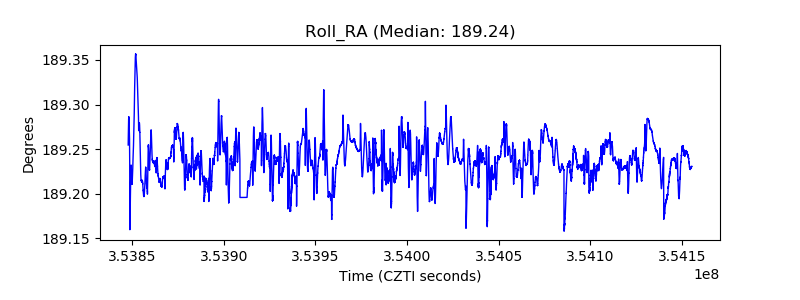 |
| Veto Counter |  |