| Param | Original file | Final file |
|---|---|---|
| Filename | modeM0/AS1C05_019T01_9000004264cztM0_level2_bc.evt | modeM0/AS1C05_019T01_9000004264cztM0_level2_quad_clean.evt |
| Size (bytes) | 4,166,147,520 | 1,635,048,000 |
| Size | 3.9 GB | 1.5 GB |
| Events in quadrant A | 20,869,658 | 10,897,265 |
| Events in quadrant B | 24,967,484 | 11,198,886 |
| Events in quadrant C | 21,099,945 | 10,524,002 |
| Events in quadrant D | 52,466,697 | 10,092,409 |
| Mode SS | |||
|---|---|---|---|
| Quadrant | BADHDUFLAG | Total packets | Discarded packets |
| A | 0 | 2026 | 0 |
| B | 0 | 2026 | 0 |
| C | 0 | 2026 | 0 |
| D | 0 | 2026 | 0 |
| Mode M0 | |||
|---|---|---|---|
| Quadrant | BADHDUFLAG | Total packets | Discarded packets |
| A | 0 | 204744 | 0 |
| B | 0 | 218575 | 0 |
| C | 0 | 214896 | 0 |
| D | 0 | 314620 | 0 |
| Mode M9 | |||
|---|---|---|---|
| Quadrant | BADHDUFLAG | Total packets | Discarded packets |
| A | 0 | 181 | 0 |
| B | 0 | 181 | 0 |
| C | 0 | 181 | 0 |
| D | 0 | 181 | 0 |
| Quadrant | Total seconds | Saturated seconds | Saturation percentage |
|---|---|---|---|
| A | 99406 | 896 | 0.901354% |
| B | 99406 | 1413 | 1.421443% |
| C | 99406 | 6440 | 6.478482% |
| D | 99406 | 7884 | 7.931111% |
Noise dominated data is calculated using 1-second bins in cleaned event files. If a bin has >2000 counts, and if more than 50% of those come from <1% of pixels, then it is considered to be noise-dominated and hence unusable.
| Quadrant | # 1 sec bins | Bins with >0 counts | Bins with >2000 counts | High rate bins dominated by noise | Noise dominated (total time) | Noise dominated (detector-on time) | Marked lightcurve |
|---|---|---|---|---|---|---|---|
| A | 117436 | 99411 | 4 | 4 | 0.00% | 0.00% | 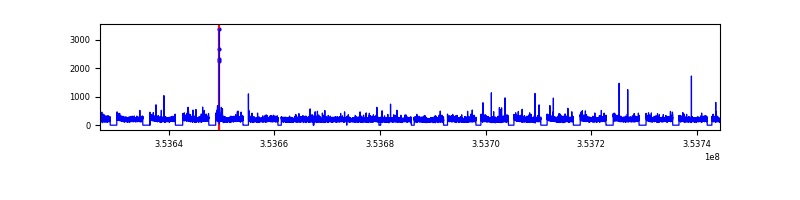 |
| B | 117436 | 99408 | 26 | 26 | 0.02% | 0.03% |  |
| C | 117436 | 99354 | 1 | 1 | 0.00% | 0.00% | 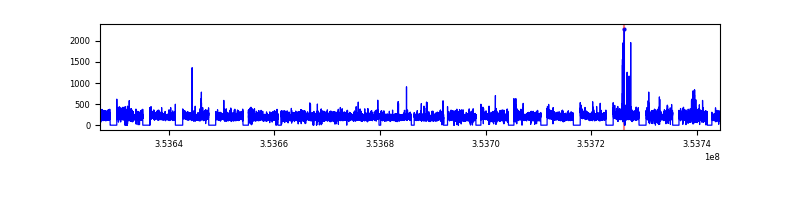 |
| D | 117436 | 99407 | 1468 | 1468 | 1.25% | 1.48% |  |
Top three noisy pixels from each quadrant. If the there are fewer than three noisy pixels in the level2.evt file, extra rows are filled as -1
| Pixel properties | Quadrant properties | ||||||
|---|---|---|---|---|---|---|---|
| Quadrant | DetID | PixID | Counts | Sigma | Mean | Median | Sigma |
| A | 13 | 254 | 179363 | 151.83 | 5359 | 5285 | 1146.5 |
| A | 0 | 13 | 139099 | 116.71 | 5359 | 5285 | 1146.5 |
| A | 0 | 226 | 33774 | 24.85 | 5359 | 5285 | 1146.5 |
| B | 0 | 189 | 3239317 | 3155.16 | 5463 | 5345 | 1025.0 |
| B | 0 | 190 | 279809 | 267.78 | 5463 | 5345 | 1025.0 |
| B | 0 | 156 | 189126 | 179.3 | 5463 | 5345 | 1025.0 |
| C | 14 | 254 | 734963 | 601.51 | 5106 | 5107 | 1213.4 |
| C | 3 | 233 | 222737 | 179.36 | 5106 | 5107 | 1213.4 |
| C | 9 | 54 | 194323 | 155.94 | 5106 | 5107 | 1213.4 |
| D | 8 | 195 | 9978511 | 8459.36 | 5126 | 4970 | 1179.0 |
| D | 12 | 33 | 9274554 | 7862.27 | 5126 | 4970 | 1179.0 |
| D | 13 | 104 | 4839817 | 4100.82 | 5126 | 4970 | 1179.0 |
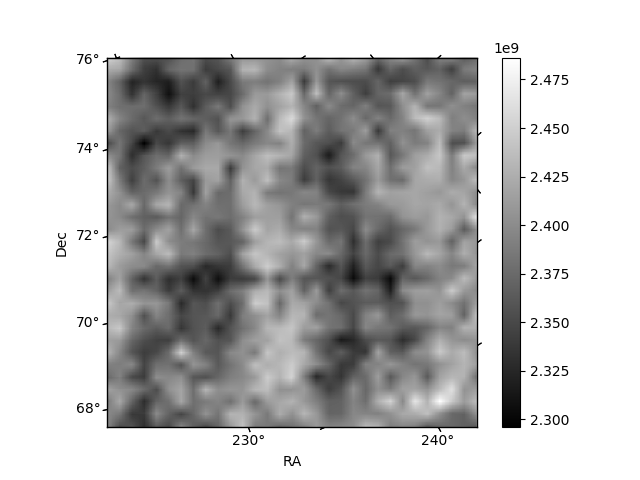
Histogram calculated using DETX and DETY for each event in the final _common_clean file
| Quadrant A |  |
 |
Quadrant B |
|---|---|---|---|
| Quadrant D |  |
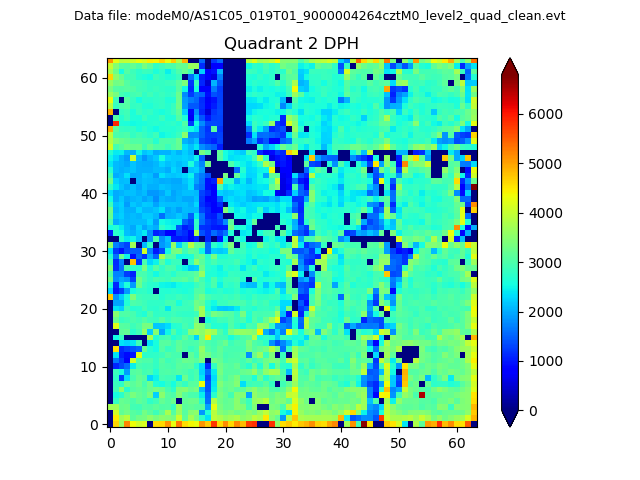 |
Quadrant C |
| Plot type | Count rate plots | Images |
|---|---|---|
| Comparison with Poisson distribution Blue bars denote a histogram of data divided into 1 sec bins. Red curve is a Poisson curve with rate = median count rate of data. |
 |
 |
| Quadrant-wise count rates Data is divided into 100 sec bins |
 |
|
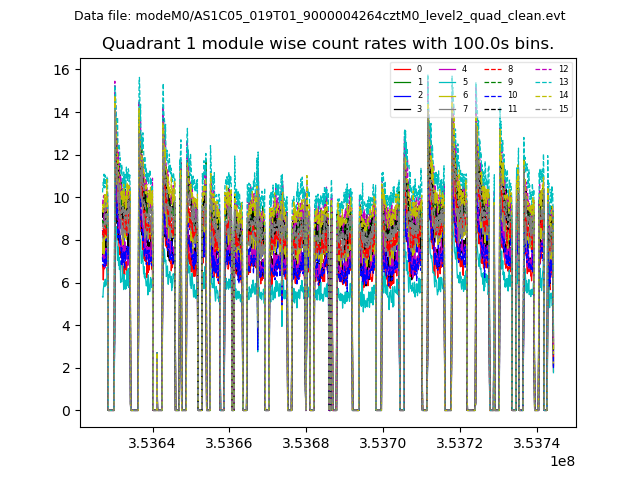
| Module-wise count rates for Quadrant A Data is divided into 100 sec bins |
 |
 |
| Module-wise count rates for Quadrant B Data is divided into 100 sec bins |
 |
 |
| Module-wise count rates for Quadrant C Data is divided into 100 sec bins |
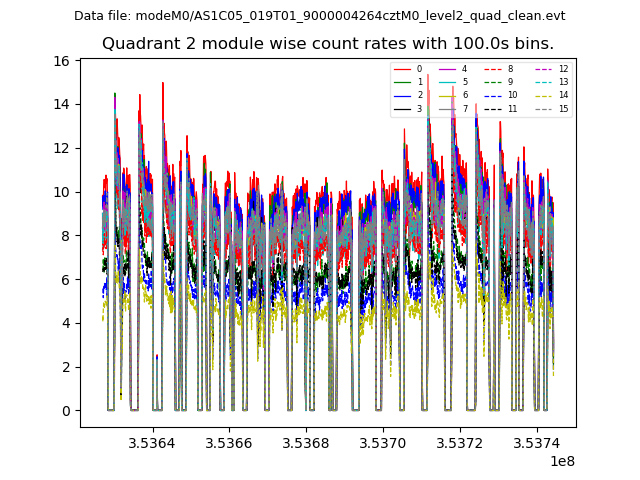 |
 |
| Module-wise count rates for Quadrant D Data is divided into 100 sec bins |
 |
 |
| Parameter | Plot |
|---|---|
| CZT HV Monitor |  |
| D_VDD |  |
| Temperature 1 |  |
| Veto HV Monitor | 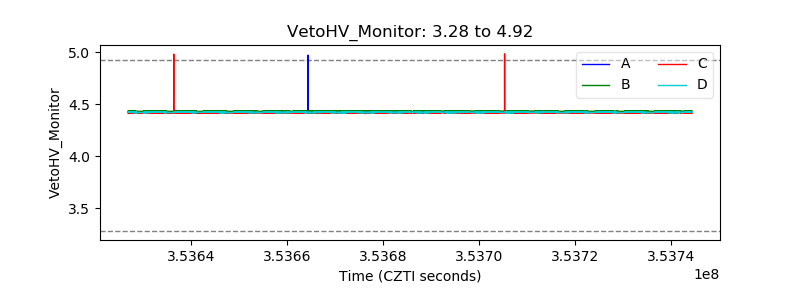 |
| Veto LLD |  |
| Alpha Counter |  |
| _CPM_Rate |  |
| CZT Counter |  |
| +2.5 Volts monitor |  |
| +5 Volts monitor |  |
| _ROLL_ROT |  |
| _Roll_DEC | 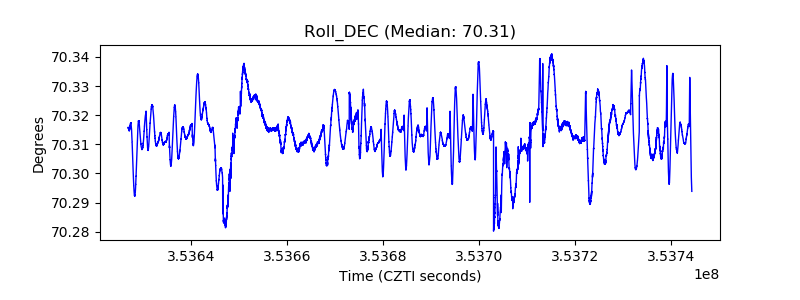 |
| _Roll_RA |  |
| Veto Counter | 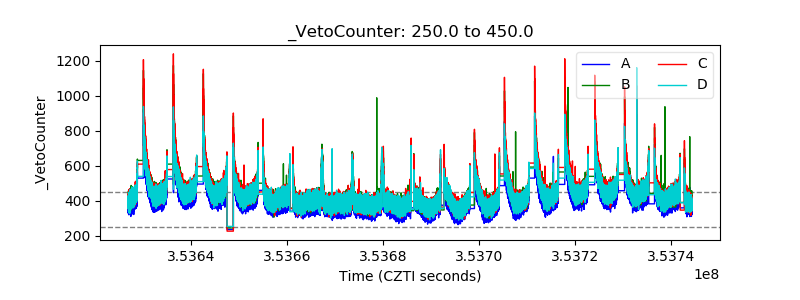 |