| Param | Original file | Final file |
|---|---|---|
| Filename | modeM0/AS1A10_104T02_9000004258cztM0_level2_bc.evt | modeM0/AS1A10_104T02_9000004258cztM0_level2_quad_clean.evt |
| Size (bytes) | 844,911,360 | 242,265,600 |
| Size | 805.8 MB | 231.0 MB |
| Events in quadrant A | 2,673,294 | 1,671,446 |
| Events in quadrant B | 3,041,670 | 1,723,326 |
| Events in quadrant C | 2,794,929 | 1,577,170 |
| Events in quadrant D | 16,170,526 | 1,447,717 |
| Mode M0 | |||
|---|---|---|---|
| Quadrant | BADHDUFLAG | Total packets | Discarded packets |
| A | 0 | 27210 | 0 |
| B | 0 | 28627 | 0 |
| C | 0 | 28865 | 0 |
| D | 0 | 69664 | 0 |
| Mode SS | |||
|---|---|---|---|
| Quadrant | BADHDUFLAG | Total packets | Discarded packets |
| A | 0 | 272 | 0 |
| B | 0 | 272 | 0 |
| C | 0 | 272 | 0 |
| D | 0 | 272 | 0 |
| Mode M9 | |||
|---|---|---|---|
| Quadrant | BADHDUFLAG | Total packets | Discarded packets |
| A | 0 | 19 | 0 |
| B | 0 | 19 | 0 |
| C | 0 | 19 | 0 |
| D | 0 | 19 | 0 |
| Quadrant | Total seconds | Saturated seconds | Saturation percentage |
|---|---|---|---|
| A | 13277 | 124 | 0.933946% |
| B | 13277 | 239 | 1.800105% |
| C | 13277 | 1143 | 8.608872% |
| D | 13277 | 2402 | 18.091436% |
Noise dominated data is calculated using 1-second bins in cleaned event files. If a bin has >2000 counts, and if more than 50% of those come from <1% of pixels, then it is considered to be noise-dominated and hence unusable.
| Quadrant | # 1 sec bins | Bins with >0 counts | Bins with >2000 counts | High rate bins dominated by noise | Noise dominated (total time) | Noise dominated (detector-on time) | Marked lightcurve |
|---|---|---|---|---|---|---|---|
| A | 15207 | 13276 | 1 | 1 | 0.01% | 0.01% |  |
| B | 15207 | 13277 | 5 | 5 | 0.03% | 0.04% |  |
| C | 15207 | 13275 | 0 | 0 | 0.00% | 0.00% | 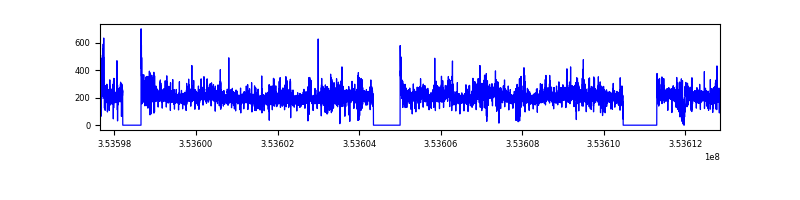 |
| D | 15207 | 13275 | 428 | 428 | 2.81% | 3.22% |  |
Top three noisy pixels from each quadrant. If the there are fewer than three noisy pixels in the level2.evt file, extra rows are filled as -1
| Pixel properties | Quadrant properties | ||||||
|---|---|---|---|---|---|---|---|
| Quadrant | DetID | PixID | Counts | Sigma | Mean | Median | Sigma |
| A | 0 | 13 | 55138 | 365.48 | 673 | 659 | 149.1 |
| A | 13 | 254 | 25246 | 164.95 | 673 | 659 | 149.1 |
| A | 0 | 226 | 4139 | 23.35 | 673 | 659 | 149.1 |
| B | 5 | 255 | 197659 | 1488.84 | 685 | 668 | 132.3 |
| B | 0 | 156 | 80452 | 603.0 | 685 | 668 | 132.3 |
| B | 0 | 189 | 40575 | 301.61 | 685 | 668 | 132.3 |
| C | 14 | 254 | 145585 | 951.46 | 629 | 624 | 152.4 |
| C | 7 | 247 | 121745 | 794.99 | 629 | 624 | 152.4 |
| C | 3 | 233 | 80748 | 525.9 | 629 | 624 | 152.4 |
| D | 8 | 195 | 11678658 | 79428.58 | 624 | 603 | 147.0 |
| D | 7 | 80 | 1159045 | 7879.17 | 624 | 603 | 147.0 |
| D | 7 | 238 | 252355 | 1712.29 | 624 | 603 | 147.0 |
Histogram calculated using DETX and DETY for each event in the final _common_clean file
| Quadrant A | 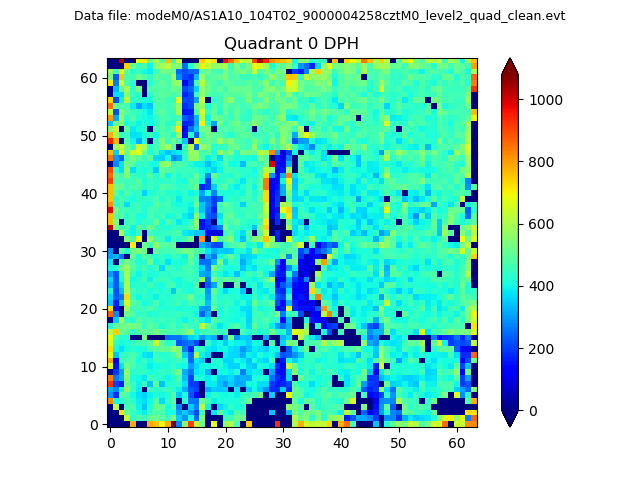 |
 |
Quadrant B |
|---|---|---|---|
| Quadrant D |  |
 |
Quadrant C |
| Plot type | Count rate plots | Images |
|---|---|---|
| Comparison with Poisson distribution Blue bars denote a histogram of data divided into 1 sec bins. Red curve is a Poisson curve with rate = median count rate of data. |
 |
 |
| Quadrant-wise count rates Data is divided into 100 sec bins |
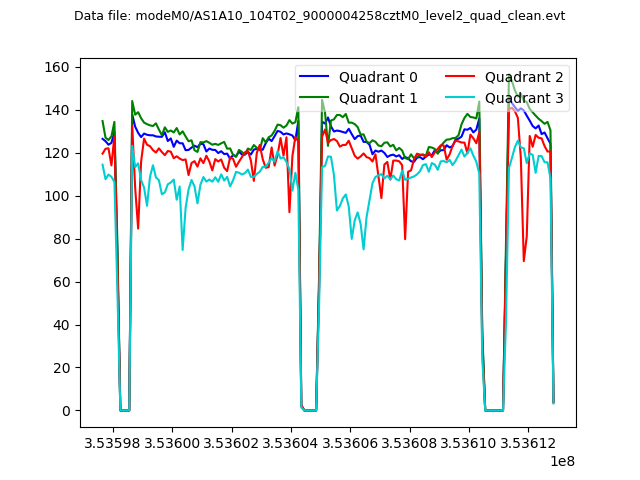 |
|
| Module-wise count rates for Quadrant A Data is divided into 100 sec bins |
 |
 |
| Module-wise count rates for Quadrant B Data is divided into 100 sec bins |
 |
 |
| Module-wise count rates for Quadrant C Data is divided into 100 sec bins |
 |
 |
| Module-wise count rates for Quadrant D Data is divided into 100 sec bins |
 |
 |
| Parameter | Plot |
|---|---|
| CZT HV Monitor |  |
| D_VDD |  |
| Temperature 1 | 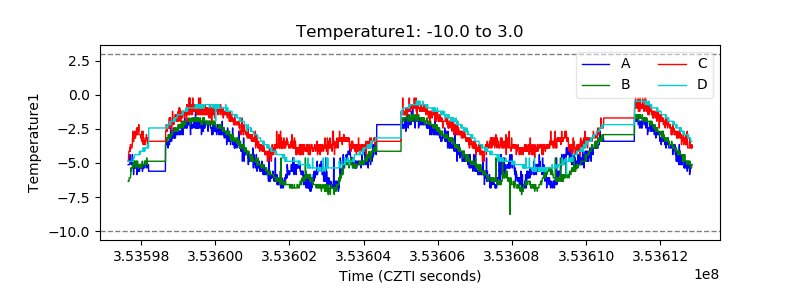 |
| Veto HV Monitor |  |
| Veto LLD |  |
| Alpha Counter |  |
| _CPM_Rate |  |
| CZT Counter | 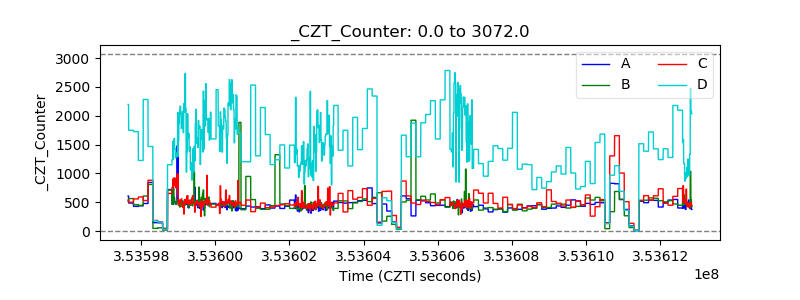 |
| +2.5 Volts monitor |  |
| +5 Volts monitor |  |
| _ROLL_ROT |  |
| _Roll_DEC | 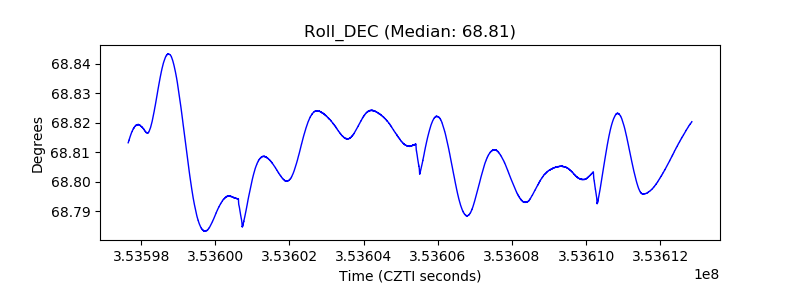 |
| _Roll_RA | 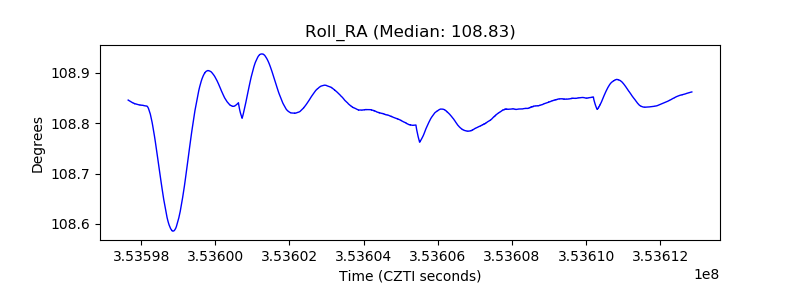 |
| Veto Counter |  |