| Param | Original file | Final file |
|---|---|---|
| Filename | modeM0/AS1A10_094T12_9000004260cztM0_level2_bc.evt | modeM0/AS1A10_094T12_9000004260cztM0_level2_quad_clean.evt |
| Size (bytes) | 211,662,720 | 60,958,080 |
| Size | 201.9 MB | 58.1 MB |
| Events in quadrant A | 878,951 | 405,724 |
| Events in quadrant B | 921,867 | 413,037 |
| Events in quadrant C | 843,419 | 378,505 |
| Events in quadrant D | 3,485,945 | 366,248 |
| Mode M0 | |||
|---|---|---|---|
| Quadrant | BADHDUFLAG | Total packets | Discarded packets |
| A | 0 | 8328 | 0 |
| B | 0 | 8523 | 0 |
| C | 0 | 9062 | 0 |
| D | 0 | 16511 | 0 |
| Mode M9 | |||
|---|---|---|---|
| Quadrant | BADHDUFLAG | Total packets | Discarded packets |
| A | 0 | 10 | 0 |
| B | 0 | 10 | 0 |
| C | 0 | 10 | 0 |
| D | 0 | 10 | 0 |
| Mode SS | |||
|---|---|---|---|
| Quadrant | BADHDUFLAG | Total packets | Discarded packets |
| A | 0 | 82 | 0 |
| B | 0 | 82 | 0 |
| C | 0 | 82 | 0 |
| D | 0 | 82 | 0 |
| Quadrant | Total seconds | Saturated seconds | Saturation percentage |
|---|---|---|---|
| A | 4001 | 10 | 0.249938% |
| B | 4001 | 19 | 0.474881% |
| C | 4001 | 605 | 15.121220% |
| D | 4001 | 97 | 2.424394% |
Noise dominated data is calculated using 1-second bins in cleaned event files. If a bin has >2000 counts, and if more than 50% of those come from <1% of pixels, then it is considered to be noise-dominated and hence unusable.
| Quadrant | # 1 sec bins | Bins with >0 counts | Bins with >2000 counts | High rate bins dominated by noise | Noise dominated (total time) | Noise dominated (detector-on time) | Marked lightcurve |
|---|---|---|---|---|---|---|---|
| A | 5021 | 4001 | 0 | 0 | 0.00% | 0.00% |  |
| B | 5021 | 4001 | 1 | 1 | 0.02% | 0.02% |  |
| C | 5021 | 3999 | 0 | 0 | 0.00% | 0.00% |  |
| D | 5021 | 4001 | 30 | 30 | 0.60% | 0.75% |  |
Top three noisy pixels from each quadrant. If the there are fewer than three noisy pixels in the level2.evt file, extra rows are filled as -1
| Pixel properties | Quadrant properties | ||||||
|---|---|---|---|---|---|---|---|
| Quadrant | DetID | PixID | Counts | Sigma | Mean | Median | Sigma |
| A | 0 | 13 | 41192 | 826.98 | 216 | 212 | 49.6 |
| A | 13 | 254 | 8096 | 159.1 | 216 | 212 | 49.6 |
| A | 3 | 1 | 1332 | 22.6 | 216 | 212 | 49.6 |
| B | 5 | 255 | 29568 | 665.59 | 217 | 212 | 44.1 |
| B | 5 | 172 | 23488 | 527.74 | 217 | 212 | 44.1 |
| B | 0 | 190 | 12431 | 277.04 | 217 | 212 | 44.1 |
| C | 14 | 254 | 60733 | 1293.1 | 190 | 189 | 46.8 |
| C | 3 | 233 | 39707 | 844.03 | 190 | 189 | 46.8 |
| C | 2 | 114 | 7235 | 150.49 | 190 | 189 | 46.8 |
| D | 8 | 195 | 2529898 | 51310.48 | 205 | 197 | 49.3 |
| D | 13 | 153 | 70778 | 1431.61 | 205 | 197 | 49.3 |
| D | 7 | 238 | 28257 | 569.15 | 205 | 197 | 49.3 |
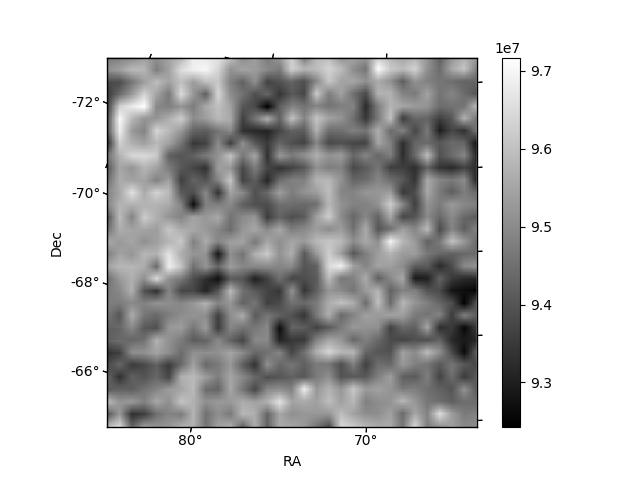
Histogram calculated using DETX and DETY for each event in the final _common_clean file
| Quadrant A |  |
 |
Quadrant B |
|---|---|---|---|
| Quadrant D |  |
 |
Quadrant C |
| Plot type | Count rate plots | Images |
|---|---|---|
| Comparison with Poisson distribution Blue bars denote a histogram of data divided into 1 sec bins. Red curve is a Poisson curve with rate = median count rate of data. |
 |
 |
| Quadrant-wise count rates Data is divided into 100 sec bins |
 |
|
| Module-wise count rates for Quadrant A Data is divided into 100 sec bins |
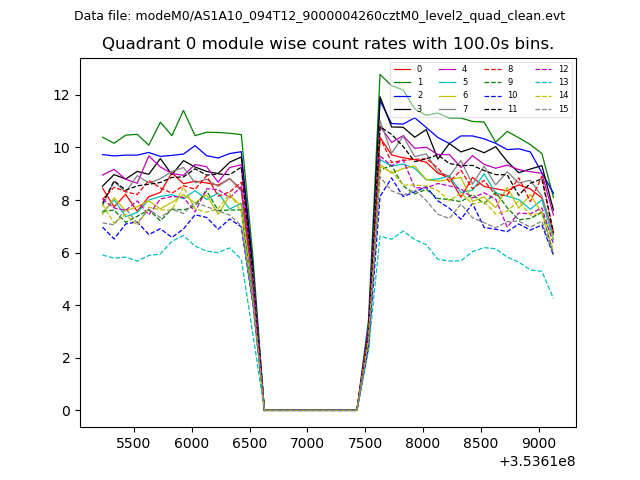 |
 |
| Module-wise count rates for Quadrant B Data is divided into 100 sec bins |
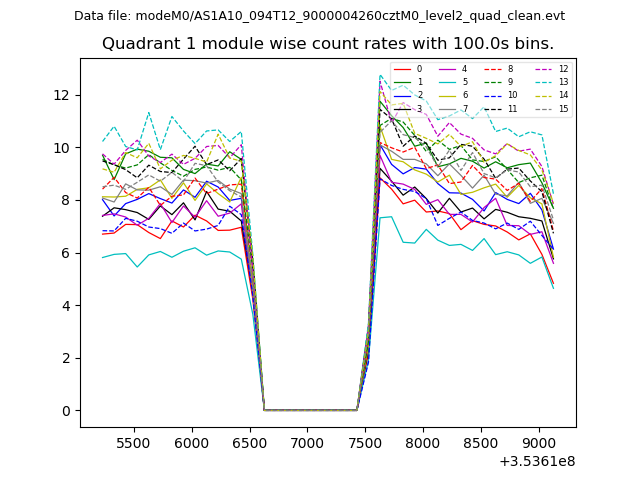 |
 |
| Module-wise count rates for Quadrant C Data is divided into 100 sec bins |
 |
 |
| Module-wise count rates for Quadrant D Data is divided into 100 sec bins |
 |
 |
| Parameter | Plot |
|---|---|
| CZT HV Monitor |  |
| D_VDD |  |
| Temperature 1 | 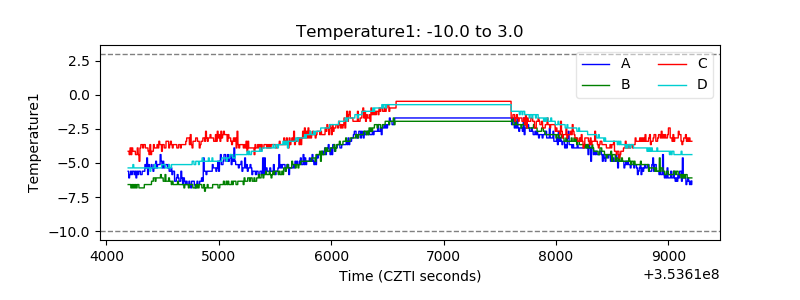 |
| Veto HV Monitor |  |
| Veto LLD |  |
| Alpha Counter |  |
| _CPM_Rate |  |
| CZT Counter |  |
| +2.5 Volts monitor | 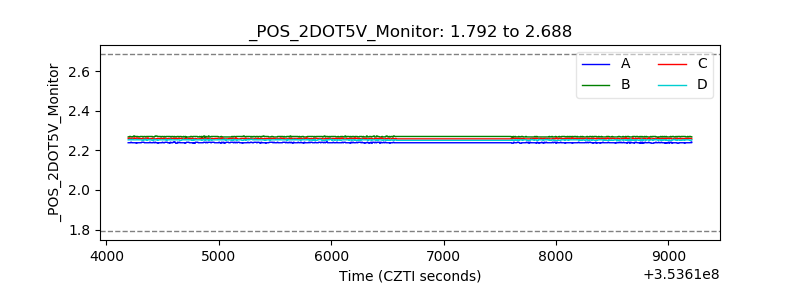 |
| +5 Volts monitor |  |
| _ROLL_ROT |  |
| _Roll_DEC | 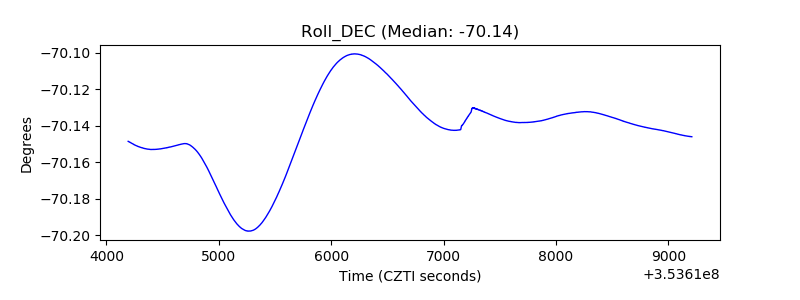 |
| _Roll_RA |  |
| Veto Counter |  |