| Param | Original file | Final file |
|---|---|---|
| Filename | modeM0/AS1A10_094T08_9000004252cztM0_level2_bc.evt | modeM0/AS1A10_094T08_9000004252cztM0_level2_quad_clean.evt |
| Size (bytes) | 373,579,200 | 67,849,920 |
| Size | 356.3 MB | 64.7 MB |
| Events in quadrant A | 956,010 | 394,119 |
| Events in quadrant B | 994,656 | 401,118 |
| Events in quadrant C | 1,025,060 | 388,184 |
| Events in quadrant D | 7,985,834 | 513,991 |
| Mode M0 | |||
|---|---|---|---|
| Quadrant | BADHDUFLAG | Total packets | Discarded packets |
| A | 0 | 9732 | 0 |
| B | 0 | 10038 | 0 |
| C | 0 | 10167 | 0 |
| D | 0 | 33623 | 0 |
| Mode SS | |||
|---|---|---|---|
| Quadrant | BADHDUFLAG | Total packets | Discarded packets |
| A | 0 | 96 | 0 |
| B | 0 | 96 | 0 |
| C | 0 | 98 | 0 |
| D | 0 | 94 | 0 |
| Quadrant | Total seconds | Saturated seconds | Saturation percentage |
|---|---|---|---|
| A | 4673 | 151 | 3.231329% |
| B | 4745 | 176 | 3.709168% |
| C | 4737 | 204 | 4.306523% |
| D | 6283 | 1081 | 17.205157% |
Noise dominated data is calculated using 1-second bins in cleaned event files. If a bin has >2000 counts, and if more than 50% of those come from <1% of pixels, then it is considered to be noise-dominated and hence unusable.
| Quadrant | # 1 sec bins | Bins with >0 counts | Bins with >2000 counts | High rate bins dominated by noise | Noise dominated (total time) | Noise dominated (detector-on time) | Marked lightcurve |
|---|---|---|---|---|---|---|---|
| A | 6318 | 4717 | 0 | 0 | 0.00% | 0.00% |  |
| B | 6318 | 4786 | 0 | 0 | 0.00% | 0.00% | 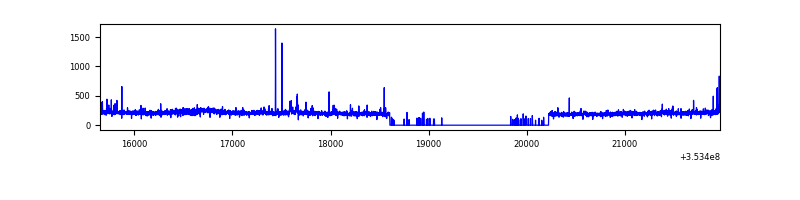 |
| C | 6318 | 4778 | 0 | 0 | 0.00% | 0.00% |  |
| D | 6318 | 6284 | 482 | 482 | 7.63% | 7.67% |  |
Top three noisy pixels from each quadrant. If the there are fewer than three noisy pixels in the level2.evt file, extra rows are filled as -1
| Pixel properties | Quadrant properties | ||||||
|---|---|---|---|---|---|---|---|
| Quadrant | DetID | PixID | Counts | Sigma | Mean | Median | Sigma |
| A | 13 | 254 | 8511 | 146.32 | 246 | 240 | 56.5 |
| A | 15 | 174 | 2631 | 42.29 | 246 | 240 | 56.5 |
| A | 0 | 226 | 1523 | 22.69 | 246 | 240 | 56.5 |
| B | 0 | 230 | 10619 | 213.45 | 247 | 241 | 48.6 |
| B | 10 | 245 | 9705 | 194.65 | 247 | 241 | 48.6 |
| B | 0 | 190 | 5863 | 115.63 | 247 | 241 | 48.6 |
| C | 3 | 233 | 74314 | 1261.35 | 239 | 237 | 58.7 |
| C | 2 | 114 | 9296 | 154.25 | 239 | 237 | 58.7 |
| C | 8 | 128 | 8916 | 147.78 | 239 | 237 | 58.7 |
| D | 8 | 195 | 6188818 | 82878.03 | 305 | 294 | 74.7 |
| D | 7 | 223 | 338060 | 4523.43 | 305 | 294 | 74.7 |
| D | 12 | 33 | 79734 | 1063.87 | 305 | 294 | 74.7 |
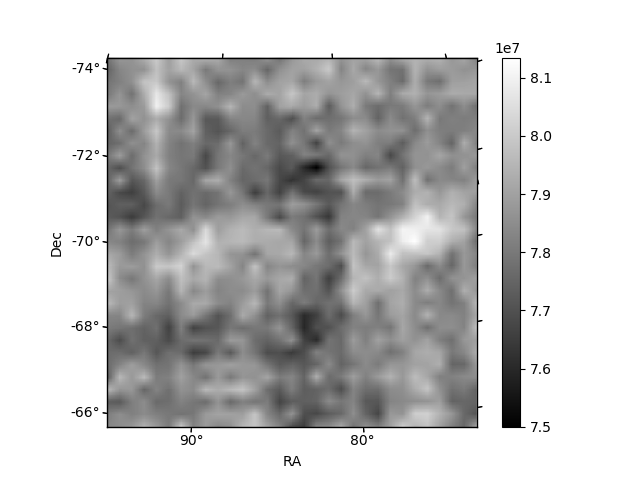
Histogram calculated using DETX and DETY for each event in the final _common_clean file
| Quadrant A |  |
 |
Quadrant B |
|---|---|---|---|
| Quadrant D |  |
 |
Quadrant C |
| Plot type | Count rate plots | Images |
|---|---|---|
| Comparison with Poisson distribution Blue bars denote a histogram of data divided into 1 sec bins. Red curve is a Poisson curve with rate = median count rate of data. |
 |
 |
| Quadrant-wise count rates Data is divided into 100 sec bins |
 |
|
| Module-wise count rates for Quadrant A Data is divided into 100 sec bins |
 |
 |
| Module-wise count rates for Quadrant B Data is divided into 100 sec bins |
 |
 |
| Module-wise count rates for Quadrant C Data is divided into 100 sec bins |
 |
 |
| Module-wise count rates for Quadrant D Data is divided into 100 sec bins |
 |
 |
| Parameter | Plot |
|---|---|
| CZT HV Monitor |  |
| D_VDD |  |
| Temperature 1 |  |
| Veto HV Monitor |  |
| Veto LLD |  |
| Alpha Counter | 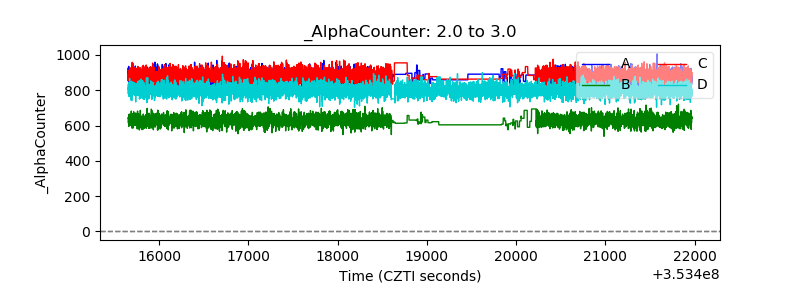 |
| _CPM_Rate |  |
| CZT Counter |  |
| +2.5 Volts monitor |  |
| +5 Volts monitor | 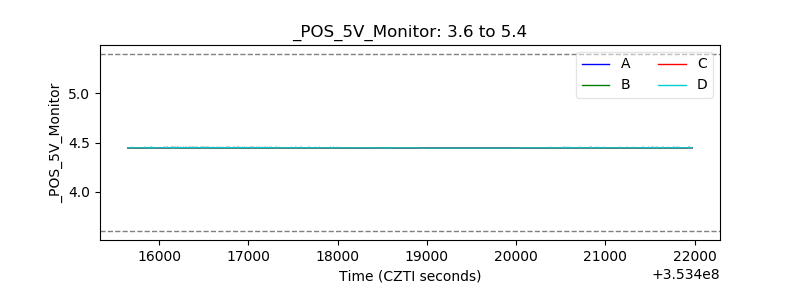 |
| _ROLL_ROT |  |
| _Roll_DEC | 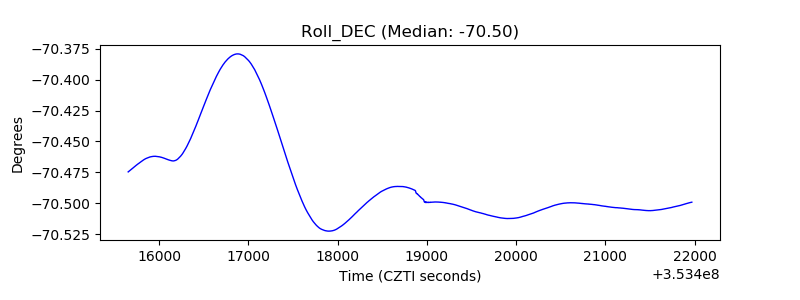 |
| _Roll_RA |  |
| Veto Counter |  |