| Param | Original file | Final file |
|---|---|---|
| Filename | modeM0/AS1A10_073T07_9000004254cztM0_level2_bc.evt | modeM0/AS1A10_073T07_9000004254cztM0_level2_quad_clean.evt |
| Size (bytes) | 8,582,780,160 | 1,696,469,760 |
| Size | 8.0 GB | 1.6 GB |
| Events in quadrant A | 27,700,536 | 10,928,337 |
| Events in quadrant B | 29,484,453 | 11,309,233 |
| Events in quadrant C | 28,935,520 | 10,879,147 |
| Events in quadrant D | 165,233,815 | 9,588,268 |
| Mode SS | |||
|---|---|---|---|
| Quadrant | BADHDUFLAG | Total packets | Discarded packets |
| A | 0 | 2582 | 0 |
| B | 0 | 2578 | 0 |
| C | 0 | 2574 | 0 |
| D | 0 | 2580 | 0 |
| Mode M9 | |||
|---|---|---|---|
| Quadrant | BADHDUFLAG | Total packets | Discarded packets |
| A | 0 | 215 | 0 |
| B | 0 | 216 | 0 |
| C | 0 | 216 | 0 |
| D | 0 | 216 | 0 |
| Mode M0 | |||
|---|---|---|---|
| Quadrant | BADHDUFLAG | Total packets | Discarded packets |
| A | 0 | 266290 | 0 |
| B | 0 | 273814 | 0 |
| C | 0 | 276140 | 0 |
| D | 0 | 696267 | 0 |
| Quadrant | Total seconds | Saturated seconds | Saturation percentage |
|---|---|---|---|
| A | 126676 | 1504 | 1.187281% |
| B | 126691 | 2182 | 1.722301% |
| C | 126651 | 4661 | 3.680192% |
| D | 126365 | 30463 | 24.107150% |
Noise dominated data is calculated using 1-second bins in cleaned event files. If a bin has >2000 counts, and if more than 50% of those come from <1% of pixels, then it is considered to be noise-dominated and hence unusable.
| Quadrant | # 1 sec bins | Bins with >0 counts | Bins with >2000 counts | High rate bins dominated by noise | Noise dominated (total time) | Noise dominated (detector-on time) | Marked lightcurve |
|---|---|---|---|---|---|---|---|
| A | 167044 | 126920 | 45 | 45 | 0.03% | 0.04% |  |
| B | 167043 | 126940 | 47 | 47 | 0.03% | 0.04% |  |
| C | 167043 | 126903 | 3 | 3 | 0.00% | 0.00% | 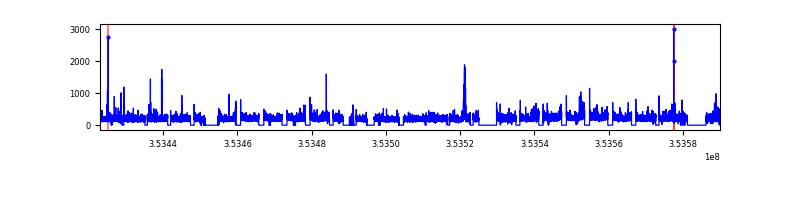 |
| D | 167043 | 126616 | 10126 | 10126 | 6.06% | 8.00% |  |
Top three noisy pixels from each quadrant. If the there are fewer than three noisy pixels in the level2.evt file, extra rows are filled as -1
| Pixel properties | Quadrant properties | ||||||
|---|---|---|---|---|---|---|---|
| Quadrant | DetID | PixID | Counts | Sigma | Mean | Median | Sigma |
| A | 0 | 13 | 917239 | 620.5 | 6892 | 6776 | 1467.3 |
| A | 13 | 254 | 235753 | 156.05 | 6892 | 6776 | 1467.3 |
| A | 11 | 29 | 59854 | 36.17 | 6892 | 6776 | 1467.3 |
| B | 5 | 255 | 1325926 | 1003.75 | 7026 | 6862 | 1314.1 |
| B | 0 | 190 | 348902 | 260.28 | 7026 | 6862 | 1314.1 |
| B | 0 | 229 | 287026 | 213.19 | 7026 | 6862 | 1314.1 |
| C | 3 | 233 | 2096738 | 1303.97 | 6764 | 6751 | 1602.8 |
| C | 14 | 254 | 435749 | 267.66 | 6764 | 6751 | 1602.8 |
| C | 2 | 114 | 244309 | 148.22 | 6764 | 6751 | 1602.8 |
| D | 8 | 195 | 124556135 | 84911.67 | 6390 | 6185 | 1466.8 |
| D | 7 | 238 | 5106708 | 3477.27 | 6390 | 6185 | 1466.8 |
| D | 7 | 69 | 2679168 | 1822.3 | 6390 | 6185 | 1466.8 |
Histogram calculated using DETX and DETY for each event in the final _common_clean file
| Quadrant A |  |
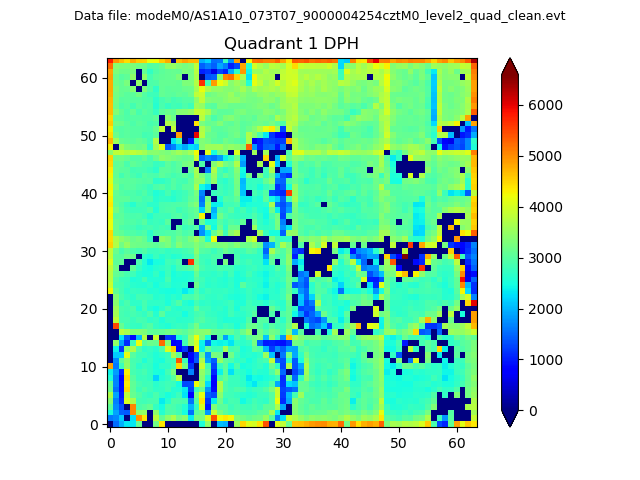 |
Quadrant B |
|---|---|---|---|
| Quadrant D |  |
 |
Quadrant C |
| Plot type | Count rate plots | Images |
|---|---|---|
| Comparison with Poisson distribution Blue bars denote a histogram of data divided into 1 sec bins. Red curve is a Poisson curve with rate = median count rate of data. |
 |
 |
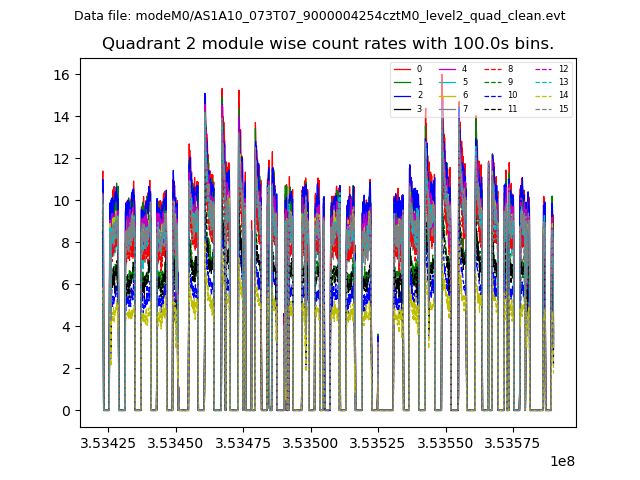
| Quadrant-wise count rates Data is divided into 100 sec bins |
 |
|
| Module-wise count rates for Quadrant A Data is divided into 100 sec bins |
 |
 |
| Module-wise count rates for Quadrant B Data is divided into 100 sec bins |
 |
 |
| Module-wise count rates for Quadrant C Data is divided into 100 sec bins |
 |
 |
| Module-wise count rates for Quadrant D Data is divided into 100 sec bins |
 |
 |
| Parameter | Plot |
|---|---|
| CZT HV Monitor |  |
| D_VDD |  |
| Temperature 1 |  |
| Veto HV Monitor |  |
| Veto LLD |  |
| Alpha Counter |  |
| _CPM_Rate |  |
| CZT Counter |  |
| +2.5 Volts monitor |  |
| +5 Volts monitor |  |
| _ROLL_ROT |  |
| _Roll_DEC |  |
| _Roll_RA |  |
| Veto Counter |  |