| Param | Original file | Final file |
|---|---|---|
| Filename | modeM0/AS1A10_094T06_9000004248cztM0_level2_bc.evt | modeM0/AS1A10_094T06_9000004248cztM0_level2_quad_clean.evt |
| Size (bytes) | 1,184,592,960 | 251,138,880 |
| Size | 1.1 GB | 239.5 MB |
| Events in quadrant A | 3,632,412 | 1,764,364 |
| Events in quadrant B | 4,280,819 | 1,798,279 |
| Events in quadrant C | 4,336,914 | 1,742,863 |
| Events in quadrant D | 22,617,545 | 1,279,272 |
| Mode M0 | |||
|---|---|---|---|
| Quadrant | BADHDUFLAG | Total packets | Discarded packets |
| A | 0 | 31257 | 0 |
| B | 0 | 34222 | 0 |
| C | 0 | 35238 | 0 |
| D | 0 | 96445 | 0 |
| Mode M9 | |||
|---|---|---|---|
| Quadrant | BADHDUFLAG | Total packets | Discarded packets |
| A | 0 | 39 | 0 |
| B | 0 | 39 | 0 |
| C | 0 | 39 | 0 |
| D | 0 | 39 | 0 |
| Mode SS | |||
|---|---|---|---|
| Quadrant | BADHDUFLAG | Total packets | Discarded packets |
| A | 0 | 302 | 0 |
| B | 0 | 302 | 0 |
| C | 0 | 302 | 0 |
| D | 0 | 302 | 0 |
| Quadrant | Total seconds | Saturated seconds | Saturation percentage |
|---|---|---|---|
| A | 14755 | 126 | 0.853948% |
| B | 14755 | 264 | 1.789224% |
| C | 14755 | 416 | 2.819383% |
| D | 14755 | 7386 | 50.057608% |
Noise dominated data is calculated using 1-second bins in cleaned event files. If a bin has >2000 counts, and if more than 50% of those come from <1% of pixels, then it is considered to be noise-dominated and hence unusable.
| Quadrant | # 1 sec bins | Bins with >0 counts | Bins with >2000 counts | High rate bins dominated by noise | Noise dominated (total time) | Noise dominated (detector-on time) | Marked lightcurve |
|---|---|---|---|---|---|---|---|
| A | 18790 | 14755 | 0 | 0 | 0.00% | 0.00% | 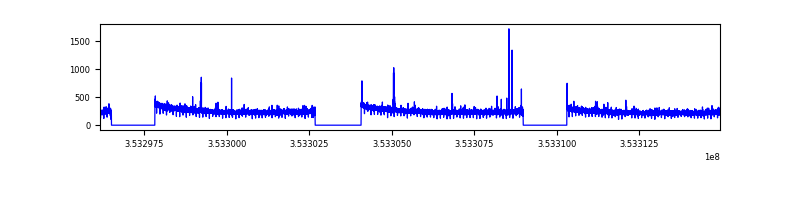 |
| B | 18790 | 14755 | 6 | 6 | 0.03% | 0.04% | 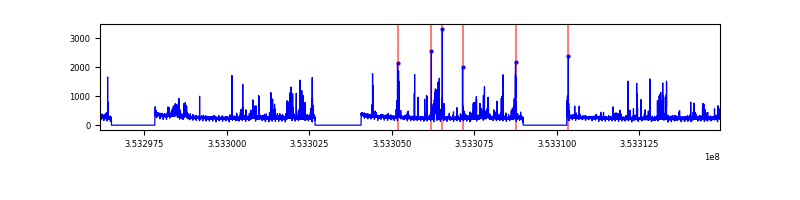 |
| C | 18790 | 14754 | 10 | 10 | 0.05% | 0.07% |  |
| D | 18790 | 14753 | 2468 | 2468 | 13.13% | 16.73% |  |
Top three noisy pixels from each quadrant. If the there are fewer than three noisy pixels in the level2.evt file, extra rows are filled as -1
| Pixel properties | Quadrant properties | ||||||
|---|---|---|---|---|---|---|---|
| Quadrant | DetID | PixID | Counts | Sigma | Mean | Median | Sigma |
| A | 13 | 254 | 27562 | 135.55 | 930 | 922 | 196.5 |
| A | 12 | 96 | 19337 | 93.7 | 930 | 922 | 196.5 |
| A | 0 | 13 | 12211 | 57.44 | 930 | 922 | 196.5 |
| B | 0 | 190 | 212849 | 1222.49 | 944 | 929 | 173.4 |
| B | 5 | 255 | 210742 | 1210.33 | 944 | 929 | 173.4 |
| B | 15 | 33 | 69419 | 395.09 | 944 | 929 | 173.4 |
| C | 3 | 233 | 463289 | 2168.68 | 909 | 914 | 213.2 |
| C | 7 | 247 | 323700 | 1513.96 | 909 | 914 | 213.2 |
| C | 2 | 114 | 30028 | 136.55 | 909 | 914 | 213.2 |
| D | 8 | 195 | 15262161 | 88137.58 | 767 | 748 | 173.2 |
| D | 12 | 33 | 2939528 | 16972.02 | 767 | 748 | 173.2 |
| D | 7 | 238 | 678515 | 3914.23 | 767 | 748 | 173.2 |
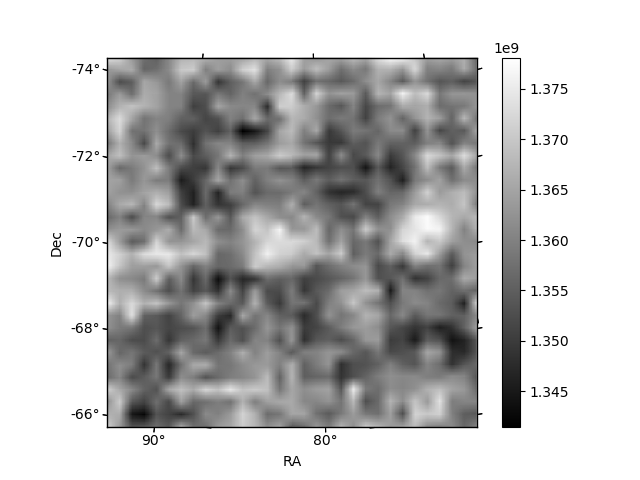
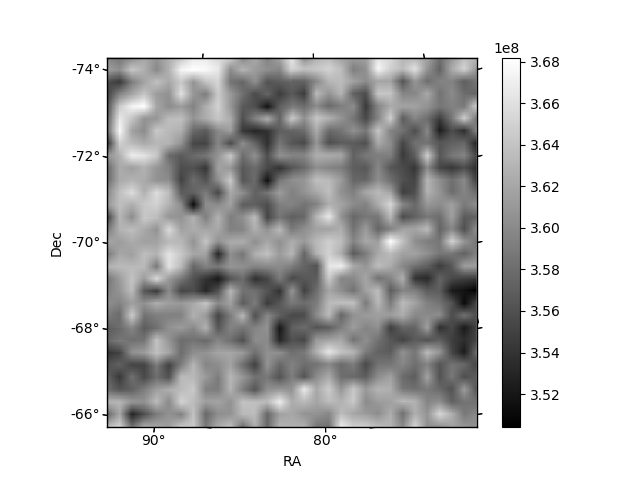
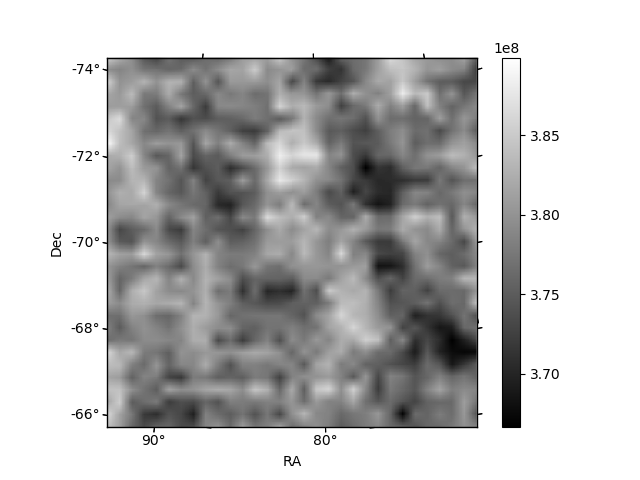
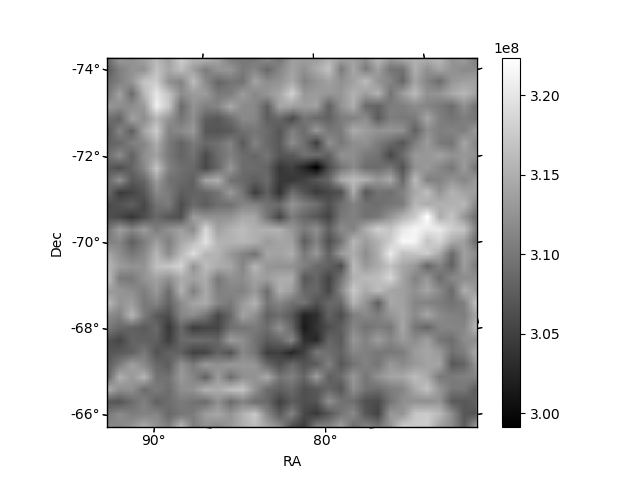
Histogram calculated using DETX and DETY for each event in the final _common_clean file
| Quadrant A |  |
 |
Quadrant B |
|---|---|---|---|
| Quadrant D |  |
 |
Quadrant C |
| Plot type | Count rate plots | Images |
|---|---|---|
| Comparison with Poisson distribution Blue bars denote a histogram of data divided into 1 sec bins. Red curve is a Poisson curve with rate = median count rate of data. |
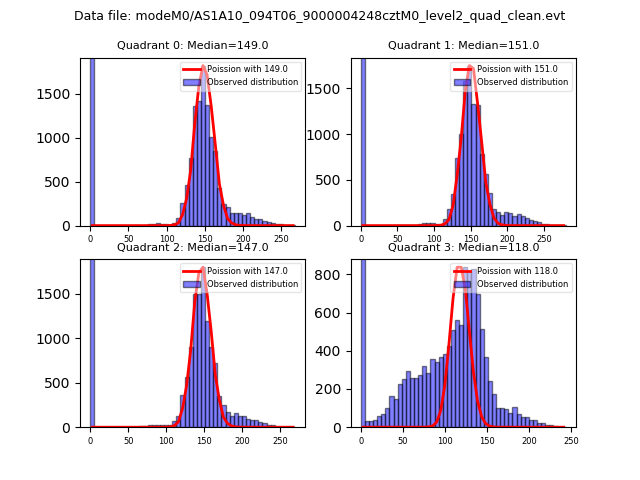 |
 |
| Quadrant-wise count rates Data is divided into 100 sec bins |
 |
|
| Module-wise count rates for Quadrant A Data is divided into 100 sec bins |
 |
 |
| Module-wise count rates for Quadrant B Data is divided into 100 sec bins |
 |
 |
| Module-wise count rates for Quadrant C Data is divided into 100 sec bins |
 |
 |
| Module-wise count rates for Quadrant D Data is divided into 100 sec bins |
 |
 |
| Parameter | Plot |
|---|---|
| CZT HV Monitor | 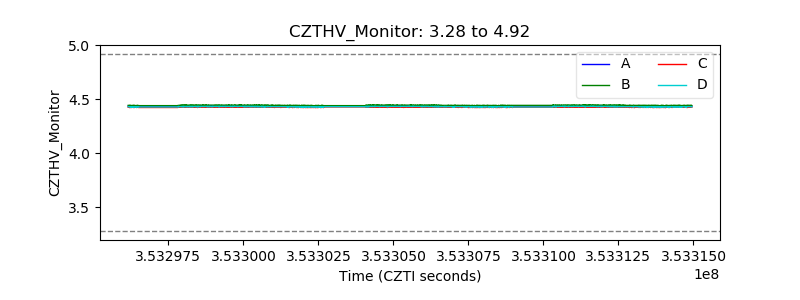 |
| D_VDD | 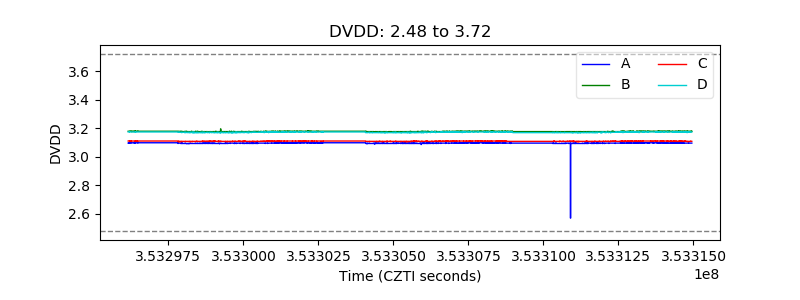 |
| Temperature 1 |  |
| Veto HV Monitor | 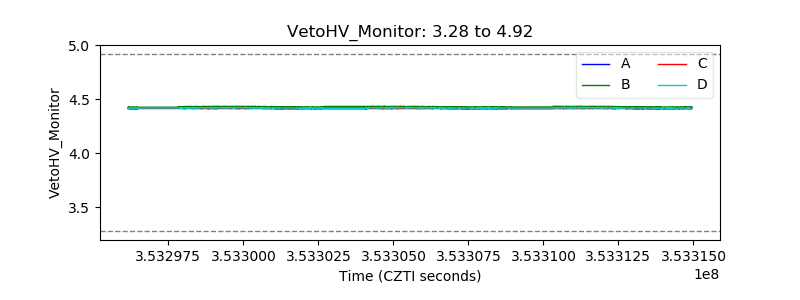 |
| Veto LLD |  |
| Alpha Counter |  |
| _CPM_Rate |  |
| CZT Counter |  |
| +2.5 Volts monitor |  |
| +5 Volts monitor |  |
| _ROLL_ROT |  |
| _Roll_DEC |  |
| _Roll_RA |  |
| Veto Counter |  |