| Param | Original file | Final file |
|---|---|---|
| Filename | modeM0/AS1A10_048T05_9000004250cztM0_level2_bc.evt | modeM0/AS1A10_048T05_9000004250cztM0_level2_quad_clean.evt |
| Size (bytes) | 5,713,989,120 | 1,046,868,480 |
| Size | 5.3 GB | 998.4 MB |
| Events in quadrant A | 17,647,022 | 6,738,423 |
| Events in quadrant B | 18,147,063 | 6,894,191 |
| Events in quadrant C | 21,992,048 | 6,659,791 |
| Events in quadrant D | 109,695,821 | 5,783,306 |
| Mode SS | |||
|---|---|---|---|
| Quadrant | BADHDUFLAG | Total packets | Discarded packets |
| A | 0 | 1672 | 0 |
| B | 0 | 1672 | 0 |
| C | 0 | 1672 | 0 |
| D | 0 | 1672 | 0 |
| Mode M9 | |||
|---|---|---|---|
| Quadrant | BADHDUFLAG | Total packets | Discarded packets |
| A | 0 | 124 | 0 |
| B | 0 | 124 | 0 |
| C | 0 | 124 | 0 |
| D | 0 | 124 | 0 |
| Mode M0 | |||
|---|---|---|---|
| Quadrant | BADHDUFLAG | Total packets | Discarded packets |
| A | 0 | 171696 | 0 |
| B | 0 | 173600 | 0 |
| C | 0 | 187983 | 0 |
| D | 0 | 469766 | 0 |
| Quadrant | Total seconds | Saturated seconds | Saturation percentage |
|---|---|---|---|
| A | 82103 | 1310 | 1.595557% |
| B | 82105 | 1552 | 1.890262% |
| C | 82105 | 2781 | 3.387126% |
| D | 82102 | 25731 | 31.340284% |
Noise dominated data is calculated using 1-second bins in cleaned event files. If a bin has >2000 counts, and if more than 50% of those come from <1% of pixels, then it is considered to be noise-dominated and hence unusable.
| Quadrant | # 1 sec bins | Bins with >0 counts | Bins with >2000 counts | High rate bins dominated by noise | Noise dominated (total time) | Noise dominated (detector-on time) | Marked lightcurve |
|---|---|---|---|---|---|---|---|
| A | 98164 | 82111 | 4 | 4 | 0.00% | 0.00% |  |
| B | 98164 | 82110 | 26 | 26 | 0.03% | 0.03% |  |
| C | 98164 | 82108 | 119 | 119 | 0.12% | 0.14% |  |
| D | 98164 | 82104 | 8455 | 8455 | 8.61% | 10.30% |  |
Top three noisy pixels from each quadrant. If the there are fewer than three noisy pixels in the level2.evt file, extra rows are filled as -1
| Pixel properties | Quadrant properties | ||||||
|---|---|---|---|---|---|---|---|
| Quadrant | DetID | PixID | Counts | Sigma | Mean | Median | Sigma |
| A | 12 | 96 | 147336 | 149.06 | 4499 | 4425 | 958.7 |
| A | 13 | 254 | 143587 | 145.15 | 4499 | 4425 | 958.7 |
| A | 0 | 13 | 81782 | 80.69 | 4499 | 4425 | 958.7 |
| B | 15 | 222 | 176088 | 201.98 | 4553 | 4446 | 849.8 |
| B | 0 | 190 | 150382 | 171.73 | 4553 | 4446 | 849.8 |
| B | 0 | 230 | 131825 | 149.89 | 4553 | 4446 | 849.8 |
| C | 3 | 233 | 2655828 | 2551.15 | 4403 | 4388 | 1039.3 |
| C | 7 | 247 | 2165222 | 2079.1 | 4403 | 4388 | 1039.3 |
| C | 2 | 114 | 159039 | 148.8 | 4403 | 4388 | 1039.3 |
| D | 8 | 195 | 76057991 | 82573.75 | 4006 | 3870 | 921.0 |
| D | 12 | 33 | 9704387 | 10532.08 | 4006 | 3870 | 921.0 |
| D | 7 | 238 | 3667240 | 3977.41 | 4006 | 3870 | 921.0 |
Histogram calculated using DETX and DETY for each event in the final _common_clean file
| Quadrant A |  |
 |
Quadrant B |
|---|---|---|---|
| Quadrant D | 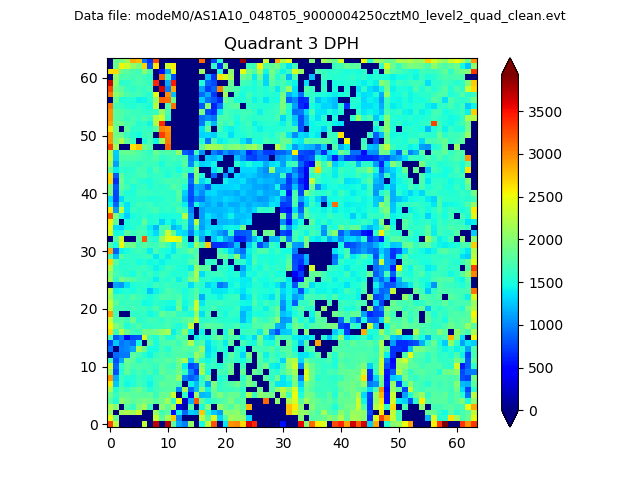 |
 |
Quadrant C |
| Plot type | Count rate plots | Images |
|---|---|---|
| Comparison with Poisson distribution Blue bars denote a histogram of data divided into 1 sec bins. Red curve is a Poisson curve with rate = median count rate of data. |
 |
 |
| Quadrant-wise count rates Data is divided into 100 sec bins |
 |
|
| Module-wise count rates for Quadrant A Data is divided into 100 sec bins |
 |
 |
| Module-wise count rates for Quadrant B Data is divided into 100 sec bins |
 |
 |
| Module-wise count rates for Quadrant C Data is divided into 100 sec bins |
 |
 |
| Module-wise count rates for Quadrant D Data is divided into 100 sec bins |
 |
 |
| Parameter | Plot |
|---|---|
| CZT HV Monitor |  |
| D_VDD |  |
| Temperature 1 |  |
| Veto HV Monitor | 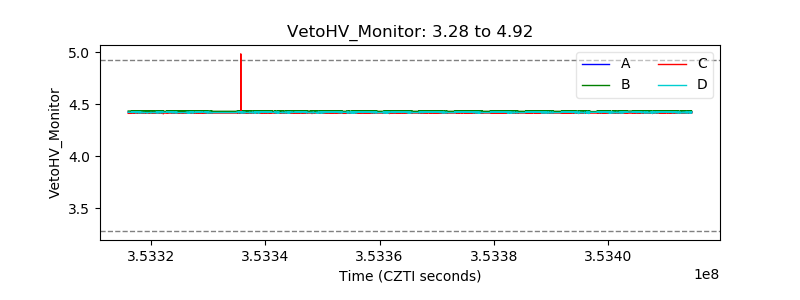 |
| Veto LLD |  |
| Alpha Counter | 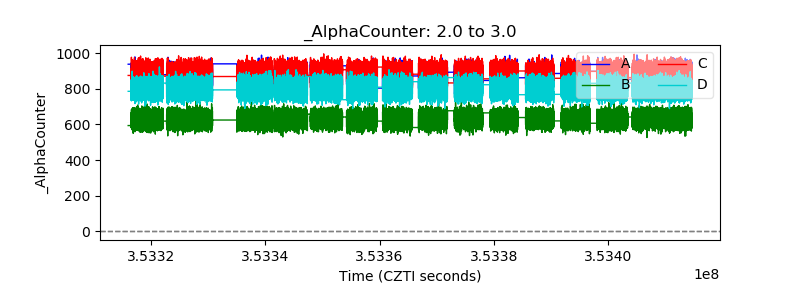 |
| _CPM_Rate |  |
| CZT Counter |  |
| +2.5 Volts monitor |  |
| +5 Volts monitor |  |
| _ROLL_ROT |  |
| _Roll_DEC |  |
| _Roll_RA |  |
| Veto Counter |  |