| Param | Original file | Final file |
|---|---|---|
| Filename | modeM0/AS1A10_094T05_9000004244cztM0_level2_bc.evt | modeM0/AS1A10_094T05_9000004244cztM0_level2_quad_clean.evt |
| Size (bytes) | 259,292,160 | 61,188,480 |
| Size | 247.3 MB | 58.4 MB |
| Events in quadrant A | 758,376 | 424,808 |
| Events in quadrant B | 792,982 | 435,492 |
| Events in quadrant C | 855,693 | 413,567 |
| Events in quadrant D | 5,190,862 | 321,148 |
| Mode M0 | |||
|---|---|---|---|
| Quadrant | BADHDUFLAG | Total packets | Discarded packets |
| A | 0 | 7384 | 0 |
| B | 0 | 7552 | 0 |
| C | 0 | 7753 | 0 |
| D | 0 | 22040 | 0 |
| Mode M9 | |||
|---|---|---|---|
| Quadrant | BADHDUFLAG | Total packets | Discarded packets |
| A | 0 | 9 | 0 |
| B | 0 | 9 | 0 |
| C | 0 | 9 | 0 |
| D | 0 | 9 | 0 |
| Mode SS | |||
|---|---|---|---|
| Quadrant | BADHDUFLAG | Total packets | Discarded packets |
| A | 0 | 76 | 0 |
| B | 0 | 76 | 0 |
| C | 0 | 76 | 0 |
| D | 0 | 76 | 0 |
| Quadrant | Total seconds | Saturated seconds | Saturation percentage |
|---|---|---|---|
| A | 3631 | 10 | 0.275406% |
| B | 3631 | 18 | 0.495731% |
| C | 3631 | 35 | 0.963922% |
| D | 3631 | 1449 | 39.906362% |
Noise dominated data is calculated using 1-second bins in cleaned event files. If a bin has >2000 counts, and if more than 50% of those come from <1% of pixels, then it is considered to be noise-dominated and hence unusable.
| Quadrant | # 1 sec bins | Bins with >0 counts | Bins with >2000 counts | High rate bins dominated by noise | Noise dominated (total time) | Noise dominated (detector-on time) | Marked lightcurve |
|---|---|---|---|---|---|---|---|
| A | 4566 | 3632 | 0 | 0 | 0.00% | 0.00% |  |
| B | 4566 | 3631 | 0 | 0 | 0.00% | 0.00% |  |
| C | 4566 | 3631 | 0 | 0 | 0.00% | 0.00% | 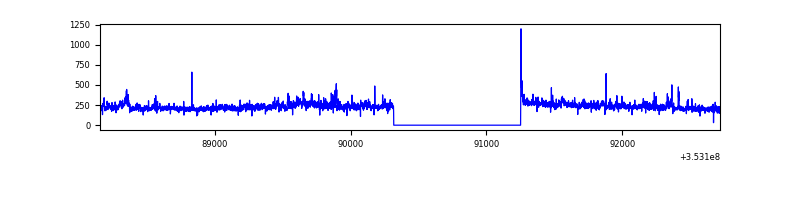 |
| D | 4566 | 3631 | 570 | 570 | 12.48% | 15.70% |  |
Top three noisy pixels from each quadrant. If the there are fewer than three noisy pixels in the level2.evt file, extra rows are filled as -1
| Pixel properties | Quadrant properties | ||||||
|---|---|---|---|---|---|---|---|
| Quadrant | DetID | PixID | Counts | Sigma | Mean | Median | Sigma |
| A | 13 | 254 | 6749 | 148.42 | 194 | 190 | 44.2 |
| A | 1 | 113 | 3325 | 70.94 | 194 | 190 | 44.2 |
| A | 5 | 203 | 1722 | 34.66 | 194 | 190 | 44.2 |
| B | 0 | 190 | 23781 | 568.7 | 198 | 192 | 41.5 |
| B | 5 | 172 | 3157 | 71.48 | 198 | 192 | 41.5 |
| B | 0 | 183 | 2385 | 52.87 | 198 | 192 | 41.5 |
| C | 3 | 233 | 104376 | 2240.79 | 187 | 185 | 46.5 |
| C | 7 | 247 | 25157 | 537.06 | 187 | 185 | 46.5 |
| C | 2 | 114 | 7167 | 150.16 | 187 | 185 | 46.5 |
| D | 8 | 195 | 3117401 | 78555.76 | 161 | 155 | 39.7 |
| D | 1 | 52 | 1039246 | 26185.48 | 161 | 155 | 39.7 |
| D | 7 | 80 | 296696 | 7472.94 | 161 | 155 | 39.7 |
Histogram calculated using DETX and DETY for each event in the final _common_clean file
| Quadrant A | 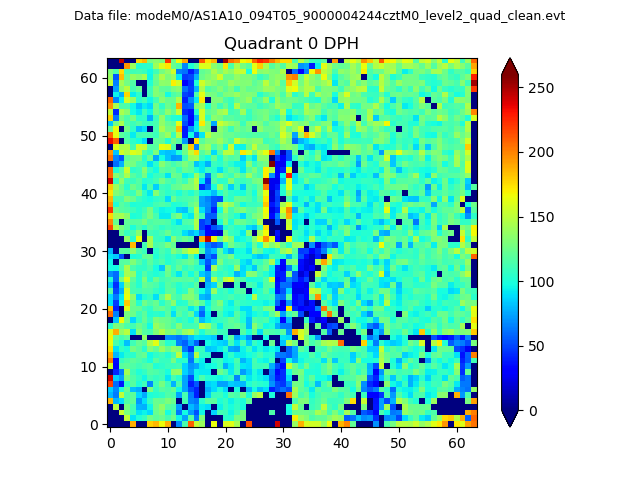 |
 |
Quadrant B |
|---|---|---|---|
| Quadrant D |  |
 |
Quadrant C |
| Plot type | Count rate plots | Images |
|---|---|---|
| Comparison with Poisson distribution Blue bars denote a histogram of data divided into 1 sec bins. Red curve is a Poisson curve with rate = median count rate of data. |
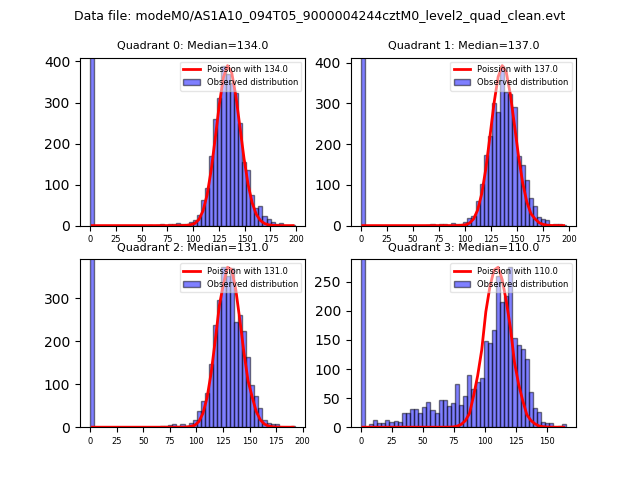 |
 |
| Quadrant-wise count rates Data is divided into 100 sec bins |
 |
|
| Module-wise count rates for Quadrant A Data is divided into 100 sec bins |
 |
 |
| Module-wise count rates for Quadrant B Data is divided into 100 sec bins |
 |
 |
| Module-wise count rates for Quadrant C Data is divided into 100 sec bins |
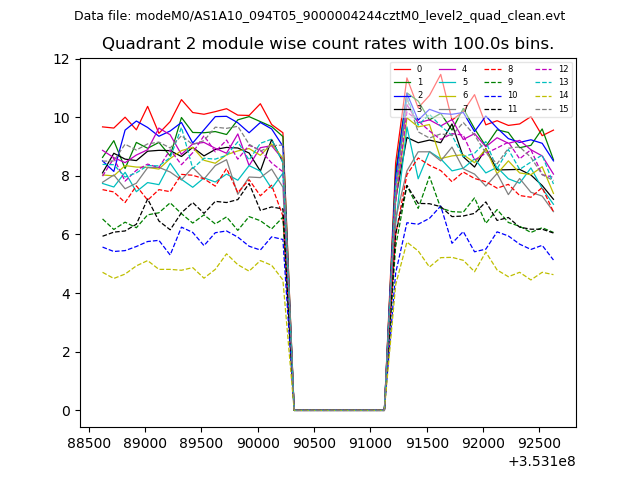 |
 |
| Module-wise count rates for Quadrant D Data is divided into 100 sec bins |
 |
 |
| Parameter | Plot |
|---|---|
| CZT HV Monitor | 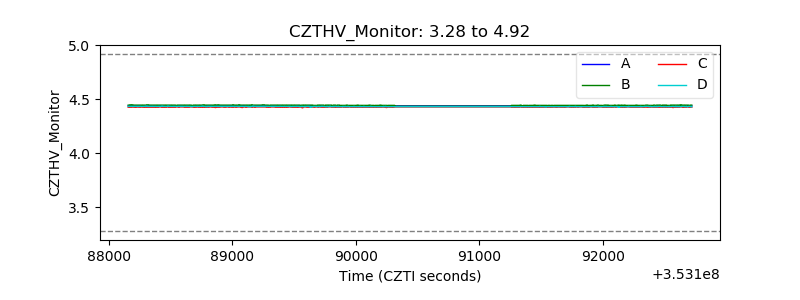 |
| D_VDD |  |
| Temperature 1 |  |
| Veto HV Monitor |  |
| Veto LLD | 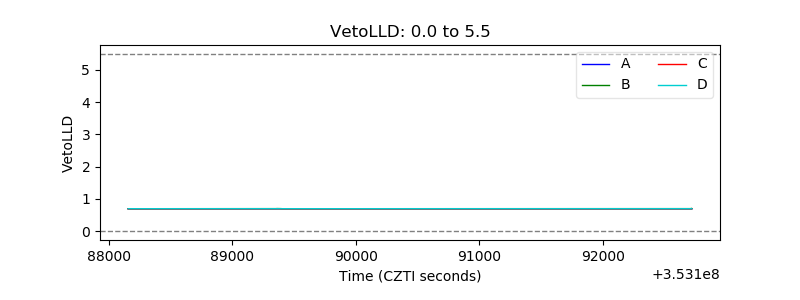 |
| Alpha Counter | 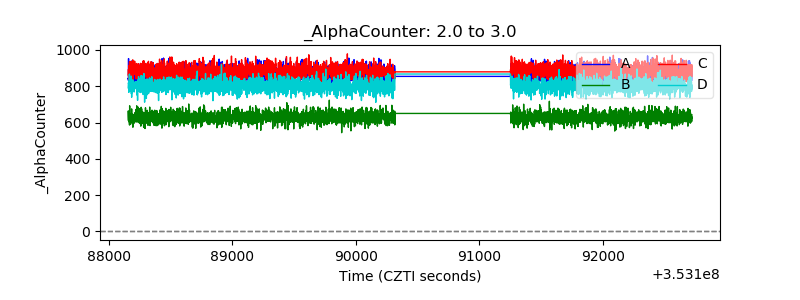 |
| _CPM_Rate |  |
| CZT Counter |  |
| +2.5 Volts monitor |  |
| +5 Volts monitor | 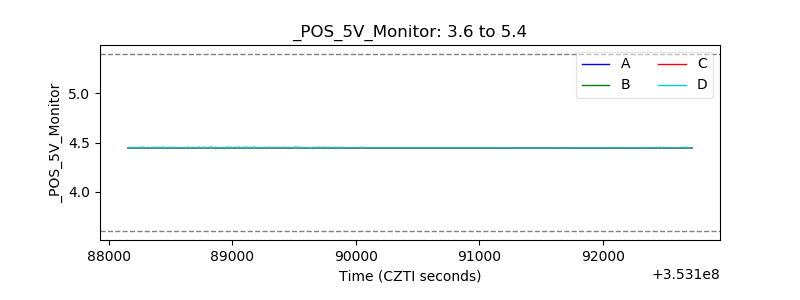 |
| _ROLL_ROT |  |
| _Roll_DEC |  |
| _Roll_RA |  |
| Veto Counter | 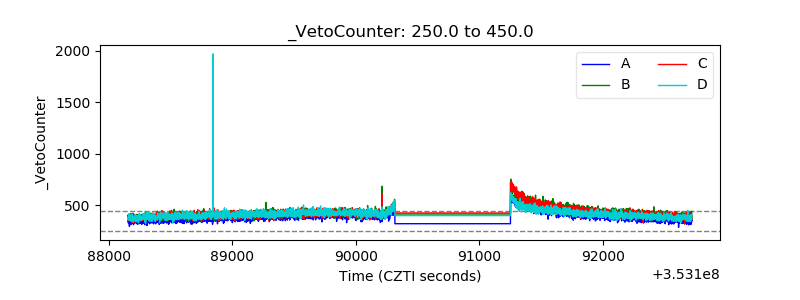 |