| Param | Original file | Final file |
|---|---|---|
| Filename | modeM0/AS1A10_064T03_9000004246cztM0_level2_bc.evt | modeM0/AS1A10_064T03_9000004246cztM0_level2_quad_clean.evt |
| Size (bytes) | 7,007,469,120 | 1,442,335,680 |
| Size | 6.5 GB | 1.3 GB |
| Events in quadrant A | 19,090,361 | 10,216,860 |
| Events in quadrant B | 19,926,560 | 10,415,522 |
| Events in quadrant C | 26,563,217 | 9,822,528 |
| Events in quadrant D | 140,689,363 | 7,206,181 |
| Mode SS | |||
|---|---|---|---|
| Quadrant | BADHDUFLAG | Total packets | Discarded packets |
| A | 0 | 1786 | 0 |
| B | 0 | 1786 | 0 |
| C | 0 | 1786 | 0 |
| D | 0 | 1786 | 0 |
| Mode M0 | |||
|---|---|---|---|
| Quadrant | BADHDUFLAG | Total packets | Discarded packets |
| A | 0 | 181952 | 0 |
| B | 0 | 185452 | 0 |
| C | 0 | 212894 | 0 |
| D | 0 | 596241 | 0 |
| Mode M9 | |||
|---|---|---|---|
| Quadrant | BADHDUFLAG | Total packets | Discarded packets |
| A | 0 | 144 | 0 |
| B | 0 | 144 | 0 |
| C | 0 | 144 | 0 |
| D | 0 | 144 | 0 |
| Quadrant | Total seconds | Saturated seconds | Saturation percentage |
|---|---|---|---|
| A | 87680 | 839 | 0.956889% |
| B | 87680 | 1082 | 1.234033% |
| C | 87680 | 3186 | 3.633668% |
| D | 87680 | 52603 | 59.994297% |
Noise dominated data is calculated using 1-second bins in cleaned event files. If a bin has >2000 counts, and if more than 50% of those come from <1% of pixels, then it is considered to be noise-dominated and hence unusable.
| Quadrant | # 1 sec bins | Bins with >0 counts | Bins with >2000 counts | High rate bins dominated by noise | Noise dominated (total time) | Noise dominated (detector-on time) | Marked lightcurve |
|---|---|---|---|---|---|---|---|
| A | 102130 | 87682 | 12 | 12 | 0.01% | 0.01% |  |
| B | 102130 | 87681 | 9 | 9 | 0.01% | 0.01% |  |
| C | 102130 | 87668 | 23 | 23 | 0.02% | 0.03% |  |
| D | 102130 | 87624 | 20522 | 20522 | 20.09% | 23.42% |  |
Top three noisy pixels from each quadrant. If the there are fewer than three noisy pixels in the level2.evt file, extra rows are filled as -1
| Pixel properties | Quadrant properties | ||||||
|---|---|---|---|---|---|---|---|
| Quadrant | DetID | PixID | Counts | Sigma | Mean | Median | Sigma |
| A | 13 | 254 | 161930 | 151.18 | 4858 | 4785 | 1039.4 |
| A | 15 | 174 | 85378 | 77.53 | 4858 | 4785 | 1039.4 |
| A | 12 | 96 | 83417 | 75.65 | 4858 | 4785 | 1039.4 |
| B | 0 | 190 | 325896 | 346.57 | 4912 | 4806 | 926.5 |
| B | 5 | 172 | 202222 | 213.08 | 4912 | 4806 | 926.5 |
| B | 0 | 230 | 192260 | 202.33 | 4912 | 4806 | 926.5 |
| C | 3 | 233 | 6935655 | 6182.8 | 4677 | 4673 | 1121.0 |
| C | 7 | 247 | 1181108 | 1049.44 | 4677 | 4673 | 1121.0 |
| C | 14 | 254 | 262201 | 229.73 | 4677 | 4673 | 1121.0 |
| D | 8 | 195 | 82228197 | 96158.93 | 3662 | 3550 | 855.1 |
| D | 1 | 52 | 20007889 | 23394.4 | 3662 | 3550 | 855.1 |
| D | 12 | 33 | 13685113 | 16000.12 | 3662 | 3550 | 855.1 |
Histogram calculated using DETX and DETY for each event in the final _common_clean file
| Quadrant A |  |
 |
Quadrant B |
|---|---|---|---|
| Quadrant D | 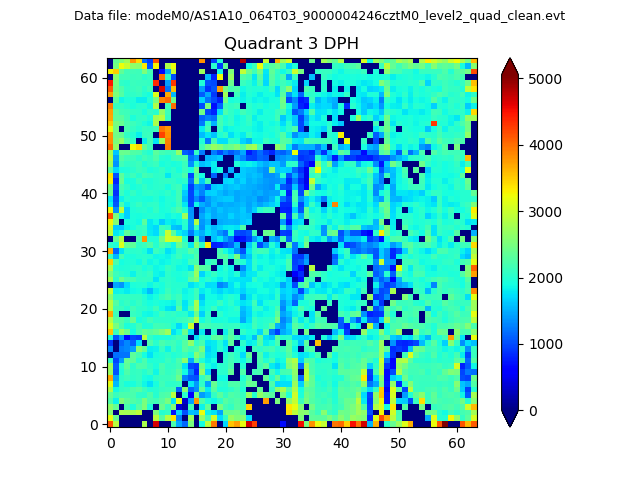 |
 |
Quadrant C |
| Plot type | Count rate plots | Images |
|---|---|---|
| Comparison with Poisson distribution Blue bars denote a histogram of data divided into 1 sec bins. Red curve is a Poisson curve with rate = median count rate of data. |
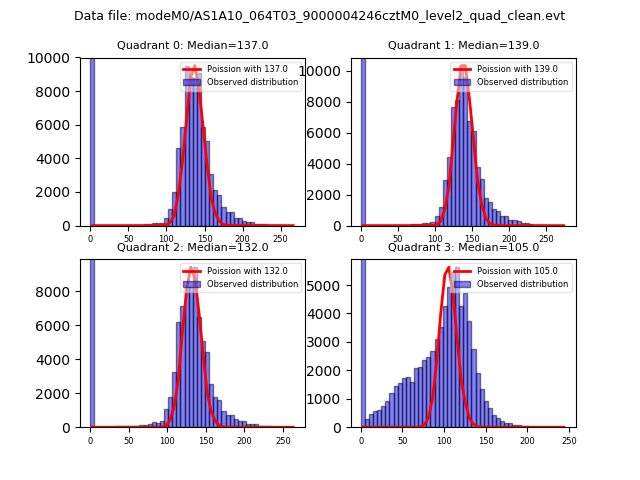 |
 |
| Quadrant-wise count rates Data is divided into 100 sec bins |
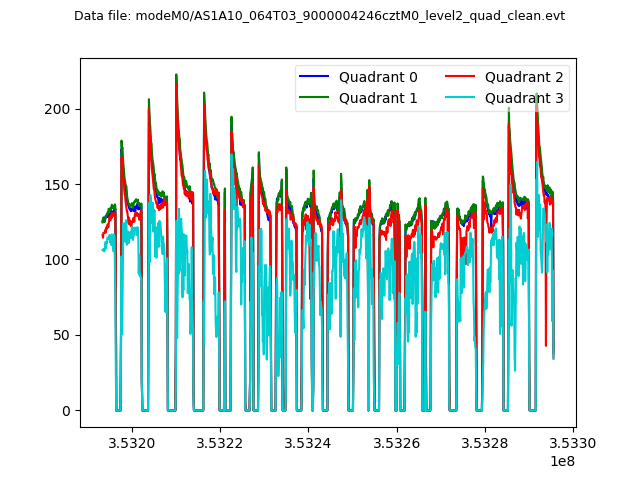 |
|
| Module-wise count rates for Quadrant A Data is divided into 100 sec bins |
 |
 |
| Module-wise count rates for Quadrant B Data is divided into 100 sec bins |
 |
 |
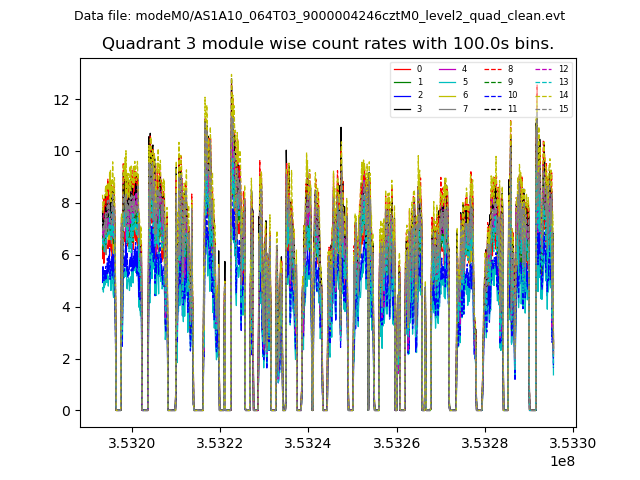
| Module-wise count rates for Quadrant C Data is divided into 100 sec bins |
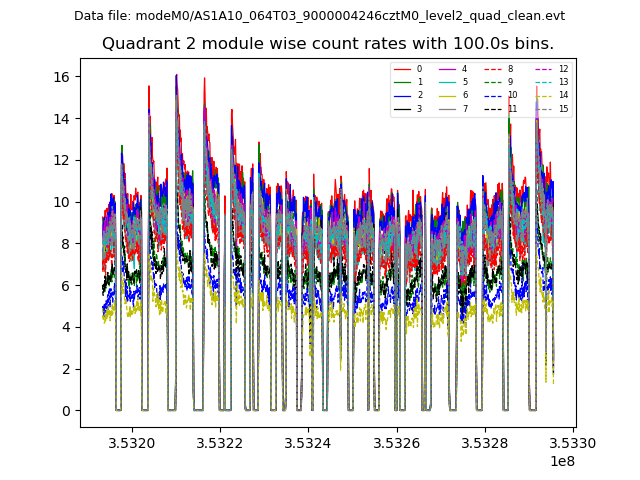 |
 |
| Module-wise count rates for Quadrant D Data is divided into 100 sec bins |
 |
 |
| Parameter | Plot |
|---|---|
| CZT HV Monitor |  |
| D_VDD |  |
| Temperature 1 |  |
| Veto HV Monitor |  |
| Veto LLD |  |
| Alpha Counter |  |
| _CPM_Rate | 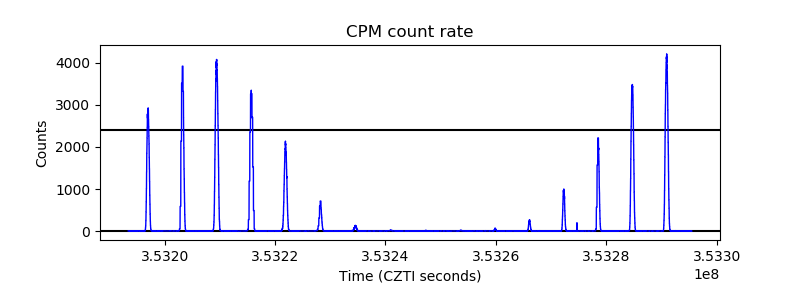 |
| CZT Counter |  |
| +2.5 Volts monitor |  |
| +5 Volts monitor |  |
| _ROLL_ROT | 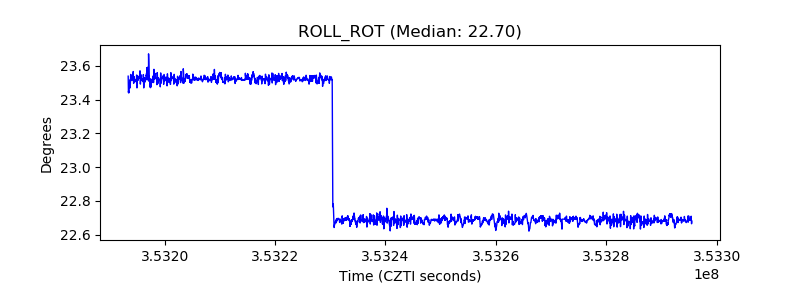 |
| _Roll_DEC |  |
| _Roll_RA | 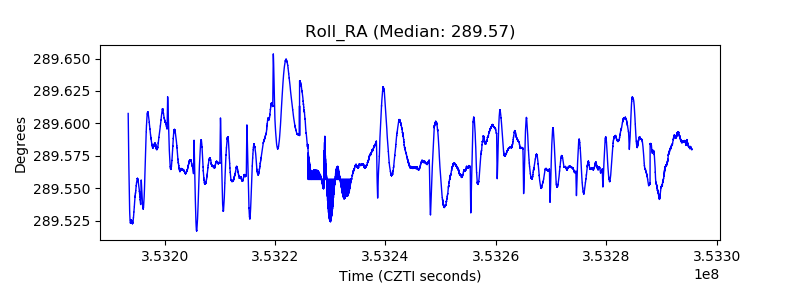 |
| Veto Counter |  |