| Param | Original file | Final file |
|---|---|---|
| Filename | modeM0/AS1A10_102T08_9000004240cztM0_level2_bc.evt | modeM0/AS1A10_102T08_9000004240cztM0_level2_quad_clean.evt |
| Size (bytes) | 4,214,635,200 | 625,204,800 |
| Size | 3.9 GB | 596.2 MB |
| Events in quadrant A | 12,773,118 | 4,275,097 |
| Events in quadrant B | 12,291,369 | 4,346,795 |
| Events in quadrant C | 12,789,710 | 3,985,172 |
| Events in quadrant D | 86,113,532 | 2,615,122 |
| Mode M0 | |||
|---|---|---|---|
| Quadrant | BADHDUFLAG | Total packets | Discarded packets |
| A | 0 | 116570 | 0 |
| B | 0 | 115499 | 0 |
| C | 0 | 122463 | 0 |
| D | 0 | 376159 | 0 |
| Mode M9 | |||
|---|---|---|---|
| Quadrant | BADHDUFLAG | Total packets | Discarded packets |
| A | 0 | 83 | 0 |
| B | 0 | 83 | 0 |
| C | 0 | 83 | 0 |
| D | 0 | 83 | 0 |
| Mode SS | |||
|---|---|---|---|
| Quadrant | BADHDUFLAG | Total packets | Discarded packets |
| A | 0 | 1098 | 0 |
| B | 0 | 1100 | 0 |
| C | 0 | 1098 | 0 |
| D | 0 | 1098 | 0 |
| Quadrant | Total seconds | Saturated seconds | Saturation percentage |
|---|---|---|---|
| A | 54024 | 983 | 1.819562% |
| B | 54009 | 1182 | 2.188524% |
| C | 54021 | 3837 | 7.102793% |
| D | 53850 | 34343 | 63.775302% |
Noise dominated data is calculated using 1-second bins in cleaned event files. If a bin has >2000 counts, and if more than 50% of those come from <1% of pixels, then it is considered to be noise-dominated and hence unusable.
| Quadrant | # 1 sec bins | Bins with >0 counts | Bins with >2000 counts | High rate bins dominated by noise | Noise dominated (total time) | Noise dominated (detector-on time) | Marked lightcurve |
|---|---|---|---|---|---|---|---|
| A | 68363 | 54121 | 8 | 8 | 0.01% | 0.01% |  |
| B | 68363 | 54098 | 3 | 3 | 0.00% | 0.01% |  |
| C | 68363 | 54095 | 2 | 2 | 0.00% | 0.00% |  |
| D | 68363 | 53899 | 14383 | 14383 | 21.04% | 26.69% | 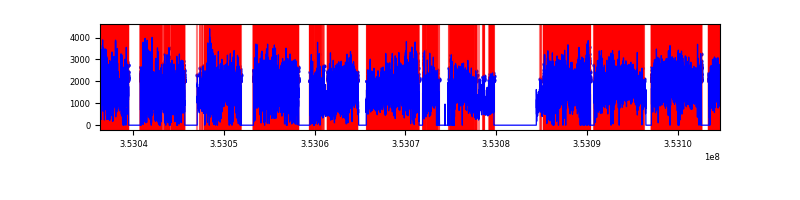 |
Top three noisy pixels from each quadrant. If the there are fewer than three noisy pixels in the level2.evt file, extra rows are filled as -1
| Pixel properties | Quadrant properties | ||||||
|---|---|---|---|---|---|---|---|
| Quadrant | DetID | PixID | Counts | Sigma | Mean | Median | Sigma |
| A | 0 | 13 | 892758 | 1376.82 | 3039 | 2992 | 646.2 |
| A | 13 | 254 | 97203 | 145.78 | 3039 | 2992 | 646.2 |
| A | 1 | 113 | 83661 | 124.83 | 3039 | 2992 | 646.2 |
| B | 5 | 255 | 132368 | 226.23 | 3073 | 3008 | 571.8 |
| B | 0 | 190 | 79776 | 134.26 | 3073 | 3008 | 571.8 |
| B | 0 | 230 | 71488 | 119.76 | 3073 | 3008 | 571.8 |
| C | 3 | 233 | 1328985 | 1998.85 | 2833 | 2823 | 663.5 |
| C | 14 | 254 | 449620 | 673.43 | 2833 | 2823 | 663.5 |
| C | 2 | 114 | 103506 | 151.75 | 2833 | 2823 | 663.5 |
| D | 8 | 195 | 48925059 | 100942.46 | 2098 | 2030 | 484.7 |
| D | 1 | 52 | 12662525 | 26122.29 | 2098 | 2030 | 484.7 |
| D | 7 | 80 | 11819751 | 24383.4 | 2098 | 2030 | 484.7 |
Histogram calculated using DETX and DETY for each event in the final _common_clean file
| Quadrant A |  |
 |
Quadrant B |
|---|---|---|---|
| Quadrant D |  |
 |
Quadrant C |
| Plot type | Count rate plots | Images |
|---|---|---|
| Comparison with Poisson distribution Blue bars denote a histogram of data divided into 1 sec bins. Red curve is a Poisson curve with rate = median count rate of data. |
 |
 |
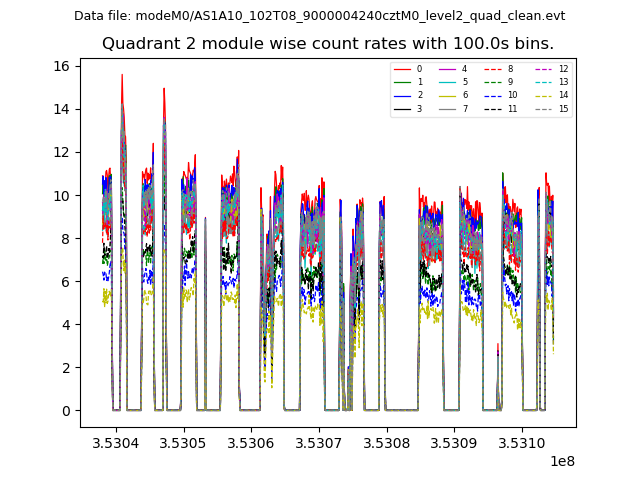
| Quadrant-wise count rates Data is divided into 100 sec bins |
 |
|
| Module-wise count rates for Quadrant A Data is divided into 100 sec bins |
 |
 |
| Module-wise count rates for Quadrant B Data is divided into 100 sec bins |
 |
 |
| Module-wise count rates for Quadrant C Data is divided into 100 sec bins |
 |
 |
| Module-wise count rates for Quadrant D Data is divided into 100 sec bins |
 |
 |
| Parameter | Plot |
|---|---|
| CZT HV Monitor |  |
| D_VDD |  |
| Temperature 1 |  |
| Veto HV Monitor |  |
| Veto LLD |  |
| Alpha Counter |  |
| _CPM_Rate |  |
| CZT Counter |  |
| +2.5 Volts monitor |  |
| +5 Volts monitor | 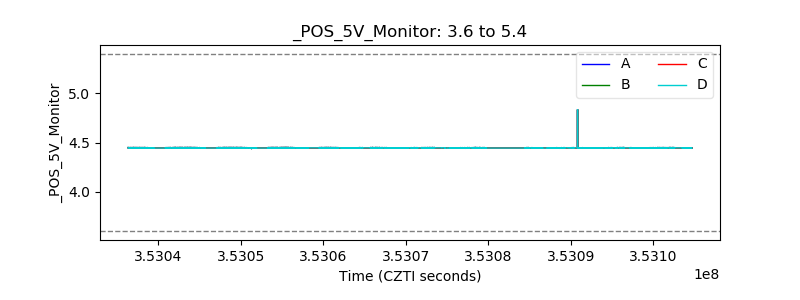 |
| _ROLL_ROT |  |
| _Roll_DEC | 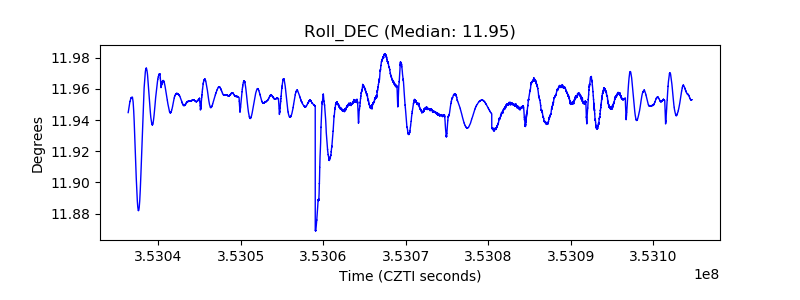 |
| _Roll_RA |  |
| Veto Counter |  |