| Param | Original file | Final file |
|---|---|---|
| Filename | modeM0/AS1A10_094T02_9000004238cztM0_level2_bc.evt | modeM0/AS1A10_094T02_9000004238cztM0_level2_quad_clean.evt |
| Size (bytes) | 750,867,840 | 154,206,720 |
| Size | 716.1 MB | 147.1 MB |
| Events in quadrant A | 2,083,545 | 1,092,462 |
| Events in quadrant B | 2,098,465 | 1,122,504 |
| Events in quadrant C | 2,163,703 | 1,065,764 |
| Events in quadrant D | 15,761,748 | 748,876 |
| Mode M0 | |||
|---|---|---|---|
| Quadrant | BADHDUFLAG | Total packets | Discarded packets |
| A | 0 | 19402 | 0 |
| B | 0 | 19471 | 0 |
| C | 0 | 20186 | 0 |
| D | 0 | 64493 | 0 |
| Mode SS | |||
|---|---|---|---|
| Quadrant | BADHDUFLAG | Total packets | Discarded packets |
| A | 0 | 188 | 0 |
| B | 0 | 188 | 0 |
| C | 0 | 188 | 0 |
| D | 0 | 188 | 0 |
| Mode M9 | |||
|---|---|---|---|
| Quadrant | BADHDUFLAG | Total packets | Discarded packets |
| A | 0 | 22 | 0 |
| B | 0 | 22 | 0 |
| C | 0 | 22 | 0 |
| D | 0 | 22 | 0 |
| Quadrant | Total seconds | Saturated seconds | Saturation percentage |
|---|---|---|---|
| A | 9209 | 46 | 0.499511% |
| B | 9209 | 50 | 0.542947% |
| C | 9209 | 220 | 2.388967% |
| D | 9209 | 5986 | 65.001629% |
Noise dominated data is calculated using 1-second bins in cleaned event files. If a bin has >2000 counts, and if more than 50% of those come from <1% of pixels, then it is considered to be noise-dominated and hence unusable.
| Quadrant | # 1 sec bins | Bins with >0 counts | Bins with >2000 counts | High rate bins dominated by noise | Noise dominated (total time) | Noise dominated (detector-on time) | Marked lightcurve |
|---|---|---|---|---|---|---|---|
| A | 11484 | 9210 | 3 | 3 | 0.03% | 0.03% |  |
| B | 11484 | 9210 | 0 | 0 | 0.00% | 0.00% |  |
| C | 11484 | 9209 | 0 | 0 | 0.00% | 0.00% |  |
| D | 11484 | 9208 | 2467 | 2467 | 21.48% | 26.79% |  |
Top three noisy pixels from each quadrant. If the there are fewer than three noisy pixels in the level2.evt file, extra rows are filled as -1
| Pixel properties | Quadrant properties | ||||||
|---|---|---|---|---|---|---|---|
| Quadrant | DetID | PixID | Counts | Sigma | Mean | Median | Sigma |
| A | 0 | 13 | 88433 | 787.08 | 514 | 507 | 111.7 |
| A | 13 | 254 | 17021 | 147.83 | 514 | 507 | 111.7 |
| A | 1 | 113 | 4363 | 34.52 | 514 | 507 | 111.7 |
| B | 5 | 255 | 19830 | 194.69 | 523 | 514 | 99.2 |
| B | 0 | 230 | 15977 | 155.85 | 523 | 514 | 99.2 |
| B | 0 | 190 | 15573 | 151.78 | 523 | 514 | 99.2 |
| C | 3 | 233 | 192833 | 1622.59 | 496 | 493 | 118.5 |
| C | 14 | 254 | 39399 | 328.21 | 496 | 493 | 118.5 |
| C | 2 | 114 | 18212 | 149.48 | 496 | 493 | 118.5 |
| D | 8 | 195 | 9438443 | 102576.63 | 393 | 381 | 92.0 |
| D | 12 | 33 | 2928529 | 31824.28 | 393 | 381 | 92.0 |
| D | 1 | 52 | 1528088 | 16603.73 | 393 | 381 | 92.0 |
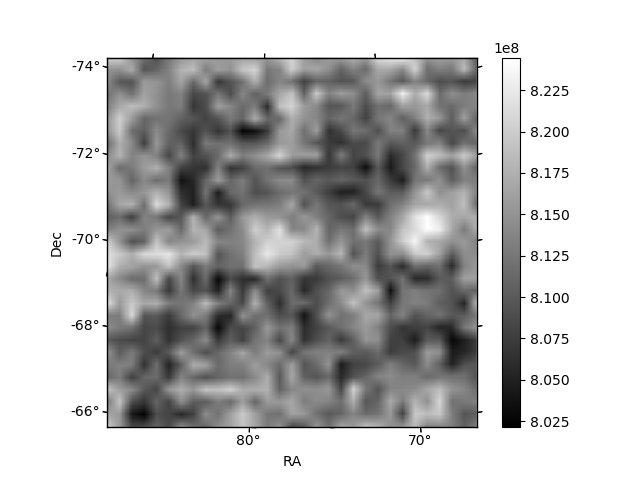
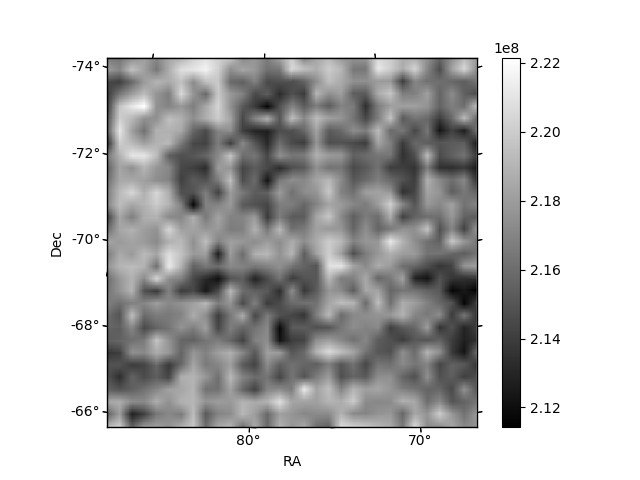
Histogram calculated using DETX and DETY for each event in the final _common_clean file
| Quadrant A |  |
 |
Quadrant B |
|---|---|---|---|
| Quadrant D |  |
 |
Quadrant C |
| Plot type | Count rate plots | Images |
|---|---|---|
| Comparison with Poisson distribution Blue bars denote a histogram of data divided into 1 sec bins. Red curve is a Poisson curve with rate = median count rate of data. |
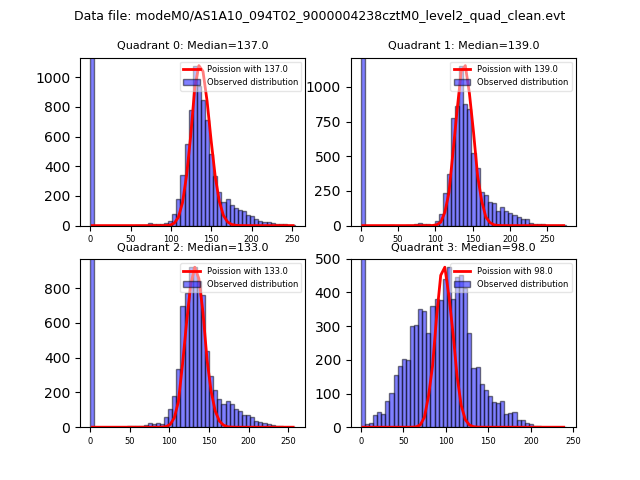 |
 |
| Quadrant-wise count rates Data is divided into 100 sec bins |
 |
|
| Module-wise count rates for Quadrant A Data is divided into 100 sec bins |
 |
 |
| Module-wise count rates for Quadrant B Data is divided into 100 sec bins |
 |
 |
| Module-wise count rates for Quadrant C Data is divided into 100 sec bins |
 |
 |
| Module-wise count rates for Quadrant D Data is divided into 100 sec bins |
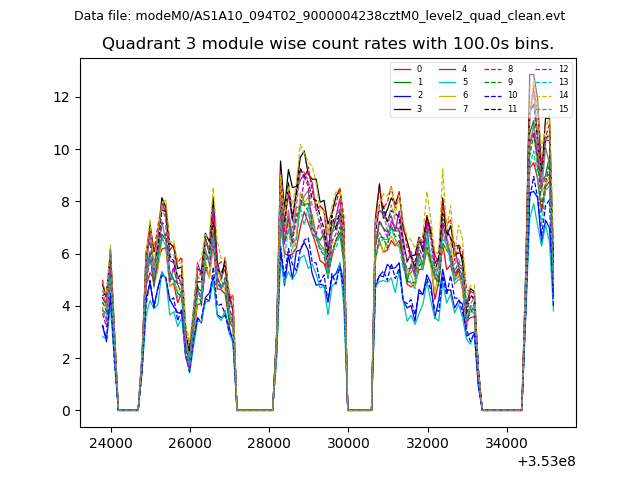 |
 |
| Parameter | Plot |
|---|---|
| CZT HV Monitor |  |
| D_VDD |  |
| Temperature 1 |  |
| Veto HV Monitor | 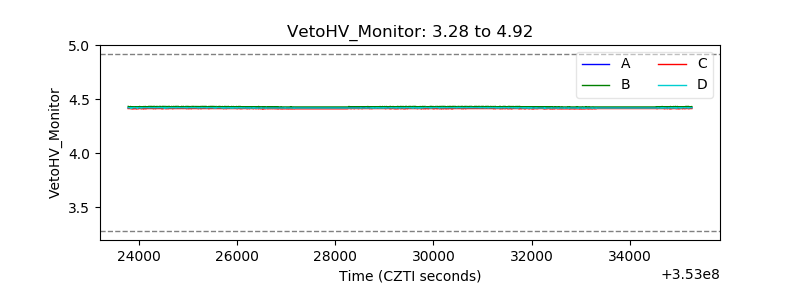 |
| Veto LLD | 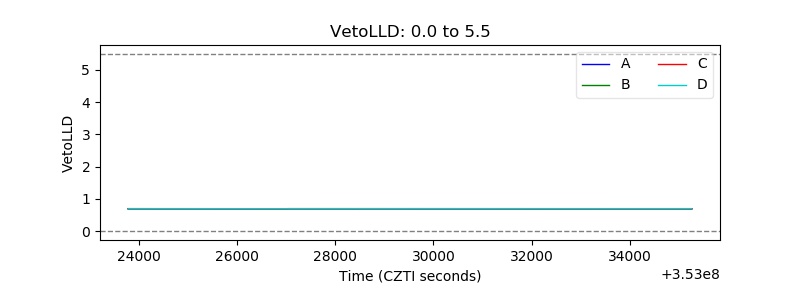 |
| Alpha Counter |  |
| _CPM_Rate |  |
| CZT Counter |  |
| +2.5 Volts monitor |  |
| +5 Volts monitor | 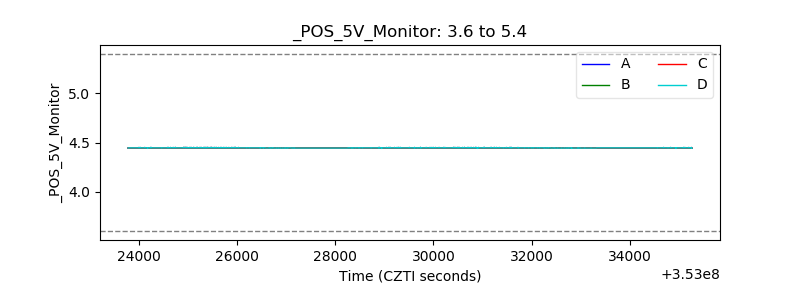 |
| _ROLL_ROT |  |
| _Roll_DEC |  |
| _Roll_RA | 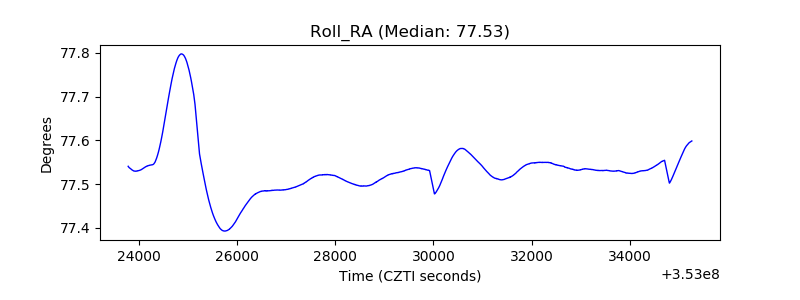 |
| Veto Counter |  |