| Param | Original file | Final file |
|---|---|---|
| Filename | modeM0/AS1A10_094T01_9000004236cztM0_level2_bc.evt | modeM0/AS1A10_094T01_9000004236cztM0_level2_quad_clean.evt |
| Size (bytes) | 388,848,960 | 72,388,800 |
| Size | 370.8 MB | 69.0 MB |
| Events in quadrant A | 953,703 | 528,009 |
| Events in quadrant B | 1,051,314 | 538,127 |
| Events in quadrant C | 1,015,169 | 499,505 |
| Events in quadrant D | 8,427,427 | 293,442 |
| Mode SS | |||
|---|---|---|---|
| Quadrant | BADHDUFLAG | Total packets | Discarded packets |
| A | 0 | 96 | 0 |
| B | 0 | 96 | 0 |
| C | 0 | 96 | 0 |
| D | 0 | 96 | 0 |
| Mode M0 | |||
|---|---|---|---|
| Quadrant | BADHDUFLAG | Total packets | Discarded packets |
| A | 0 | 9576 | 0 |
| B | 0 | 9925 | 0 |
| C | 0 | 10241 | 0 |
| D | 0 | 34899 | 0 |
| Mode M9 | |||
|---|---|---|---|
| Quadrant | BADHDUFLAG | Total packets | Discarded packets |
| A | 0 | 9 | 0 |
| B | 0 | 9 | 0 |
| C | 0 | 9 | 0 |
| D | 0 | 9 | 0 |
| Quadrant | Total seconds | Saturated seconds | Saturation percentage |
|---|---|---|---|
| A | 4718 | 16 | 0.339127% |
| B | 4718 | 30 | 0.635863% |
| C | 4718 | 251 | 5.320051% |
| D | 4718 | 3540 | 75.031793% |
Noise dominated data is calculated using 1-second bins in cleaned event files. If a bin has >2000 counts, and if more than 50% of those come from <1% of pixels, then it is considered to be noise-dominated and hence unusable.
| Quadrant | # 1 sec bins | Bins with >0 counts | Bins with >2000 counts | High rate bins dominated by noise | Noise dominated (total time) | Noise dominated (detector-on time) | Marked lightcurve |
|---|---|---|---|---|---|---|---|
| A | 5643 | 4718 | 0 | 0 | 0.00% | 0.00% |  |
| B | 5643 | 4718 | 2 | 2 | 0.04% | 0.04% | 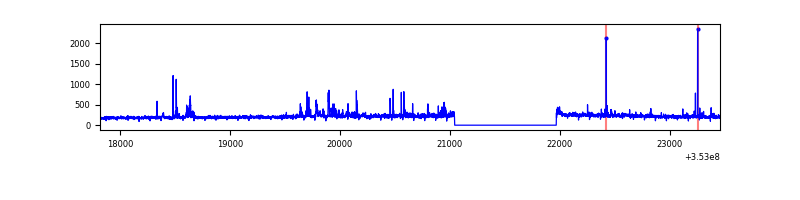 |
| C | 5643 | 4718 | 0 | 0 | 0.00% | 0.00% |  |
| D | 5643 | 4718 | 1542 | 1542 | 27.33% | 32.68% |  |
Top three noisy pixels from each quadrant. If the there are fewer than three noisy pixels in the level2.evt file, extra rows are filled as -1
| Pixel properties | Quadrant properties | ||||||
|---|---|---|---|---|---|---|---|
| Quadrant | DetID | PixID | Counts | Sigma | Mean | Median | Sigma |
| A | 13 | 254 | 8451 | 147.8 | 245 | 240 | 55.6 |
| A | 0 | 226 | 1530 | 23.22 | 245 | 240 | 55.6 |
| A | 12 | 194 | 1469 | 22.12 | 245 | 240 | 55.6 |
| B | 0 | 229 | 40125 | 801.17 | 248 | 243 | 49.8 |
| B | 0 | 230 | 16979 | 336.2 | 248 | 243 | 49.8 |
| B | 0 | 190 | 11231 | 220.73 | 248 | 243 | 49.8 |
| C | 3 | 233 | 69484 | 1205.93 | 230 | 228 | 57.4 |
| C | 14 | 254 | 47537 | 823.78 | 230 | 228 | 57.4 |
| C | 2 | 114 | 9011 | 152.94 | 230 | 228 | 57.4 |
| D | 8 | 195 | 4679835 | 115151.04 | 162 | 155 | 40.6 |
| D | 12 | 33 | 1582388 | 38933.38 | 162 | 155 | 40.6 |
| D | 1 | 52 | 616388 | 15163.39 | 162 | 155 | 40.6 |
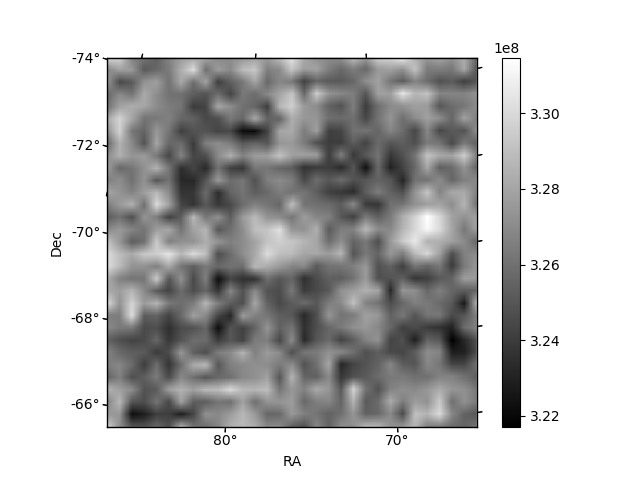
Histogram calculated using DETX and DETY for each event in the final _common_clean file
| Quadrant A |  |
 |
Quadrant B |
|---|---|---|---|
| Quadrant D |  |
 |
Quadrant C |
| Plot type | Count rate plots | Images |
|---|---|---|
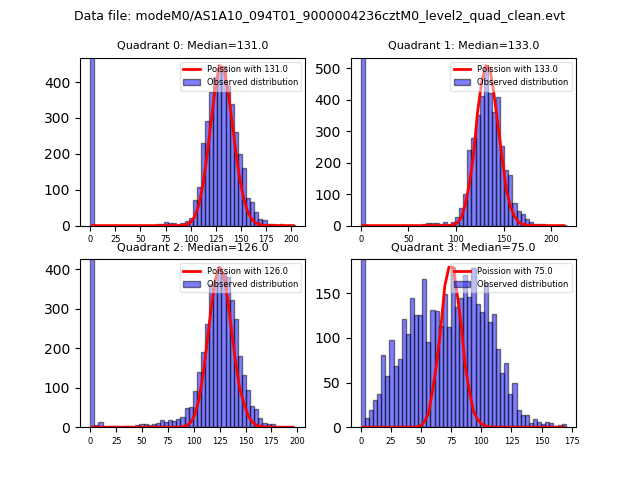
| Comparison with Poisson distribution Blue bars denote a histogram of data divided into 1 sec bins. Red curve is a Poisson curve with rate = median count rate of data. |
 |
 |
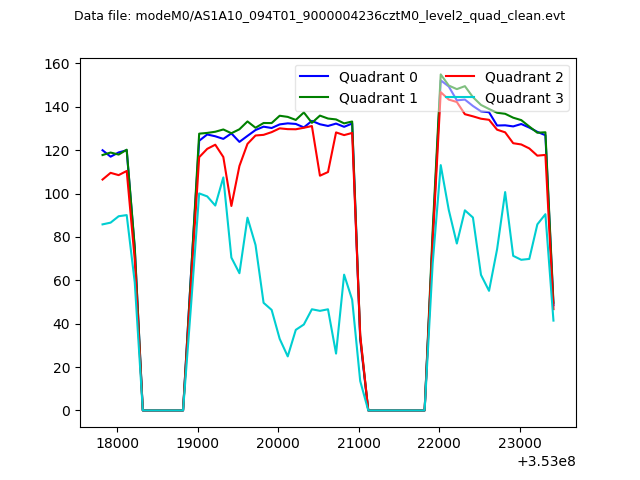
| Quadrant-wise count rates Data is divided into 100 sec bins |
 |
|
| Module-wise count rates for Quadrant A Data is divided into 100 sec bins |
 |
 |
| Module-wise count rates for Quadrant B Data is divided into 100 sec bins |
 |
 |
| Module-wise count rates for Quadrant C Data is divided into 100 sec bins |
 |
 |
| Module-wise count rates for Quadrant D Data is divided into 100 sec bins |
 |
 |
| Parameter | Plot |
|---|---|
| CZT HV Monitor | 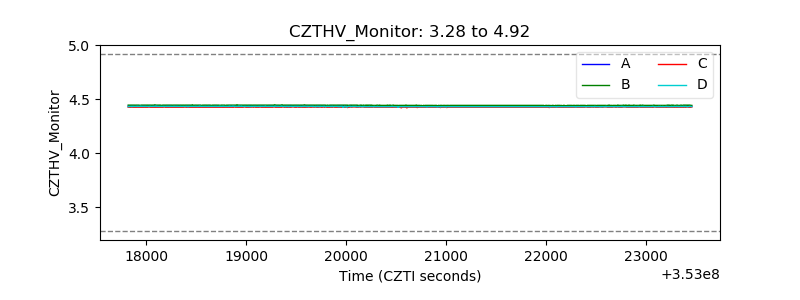 |
| D_VDD |  |
| Temperature 1 |  |
| Veto HV Monitor |  |
| Veto LLD |  |
| Alpha Counter |  |
| _CPM_Rate | 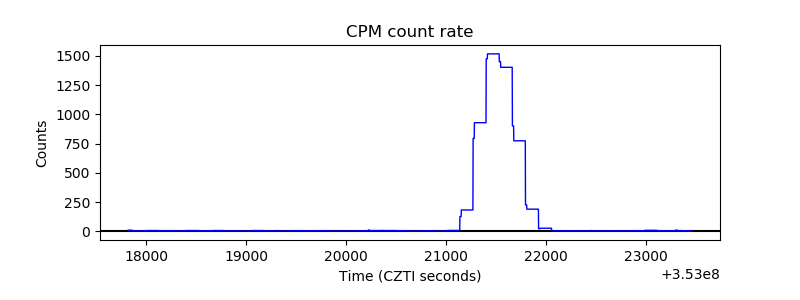 |
| CZT Counter |  |
| +2.5 Volts monitor |  |
| +5 Volts monitor |  |
| _ROLL_ROT |  |
| _Roll_DEC |  |
| _Roll_RA |  |
| Veto Counter | 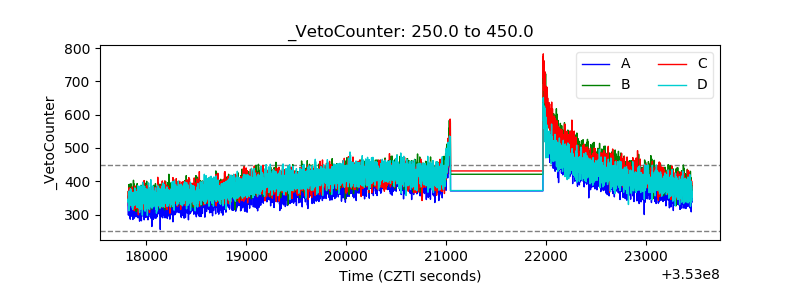 |