| Param | Original file | Final file |
|---|---|---|
| Filename | modeM0/AS1A10_102T11_9000004230cztM0_level2_bc.evt | modeM0/AS1A10_102T11_9000004230cztM0_level2_quad_clean.evt |
| Size (bytes) | 4,966,885,440 | 1,092,101,760 |
| Size | 4.6 GB | 1.0 GB |
| Events in quadrant A | 19,200,890 | 7,094,537 |
| Events in quadrant B | 22,724,587 | 7,202,251 |
| Events in quadrant C | 48,274,314 | 6,687,507 |
| Events in quadrant D | 54,677,759 | 6,492,835 |
| Mode SS | |||
|---|---|---|---|
| Quadrant | BADHDUFLAG | Total packets | Discarded packets |
| A | 0 | 1664 | 0 |
| B | 0 | 1664 | 0 |
| C | 0 | 1664 | 0 |
| D | 0 | 1664 | 0 |
| Mode M0 | |||
|---|---|---|---|
| Quadrant | BADHDUFLAG | Total packets | Discarded packets |
| A | 0 | 174767 | 0 |
| B | 0 | 189199 | 0 |
| C | 0 | 275404 | 0 |
| D | 0 | 307690 | 0 |
| Mode M9 | |||
|---|---|---|---|
| Quadrant | BADHDUFLAG | Total packets | Discarded packets |
| A | 0 | 116 | 0 |
| B | 0 | 116 | 0 |
| C | 0 | 116 | 0 |
| D | 0 | 116 | 0 |
| Quadrant | Total seconds | Saturated seconds | Saturation percentage |
|---|---|---|---|
| A | 81647 | 1339 | 1.639987% |
| B | 81647 | 2580 | 3.159945% |
| C | 81647 | 10777 | 13.199505% |
| D | 81647 | 12312 | 15.079550% |
Noise dominated data is calculated using 1-second bins in cleaned event files. If a bin has >2000 counts, and if more than 50% of those come from <1% of pixels, then it is considered to be noise-dominated and hence unusable.
| Quadrant | # 1 sec bins | Bins with >0 counts | Bins with >2000 counts | High rate bins dominated by noise | Noise dominated (total time) | Noise dominated (detector-on time) | Marked lightcurve |
|---|---|---|---|---|---|---|---|
| A | 93452 | 81650 | 42 | 42 | 0.04% | 0.05% |  |
| B | 93452 | 81650 | 163 | 163 | 0.17% | 0.20% |  |
| C | 93452 | 81648 | 1690 | 1690 | 1.81% | 2.07% |  |
| D | 93452 | 81648 | 2043 | 2043 | 2.19% | 2.50% |  |
Top three noisy pixels from each quadrant. If the there are fewer than three noisy pixels in the level2.evt file, extra rows are filled as -1
| Pixel properties | Quadrant properties | ||||||
|---|---|---|---|---|---|---|---|
| Quadrant | DetID | PixID | Counts | Sigma | Mean | Median | Sigma |
| A | 1 | 113 | 1920915 | 2035.34 | 4403 | 4336 | 941.7 |
| A | 0 | 13 | 234577 | 244.51 | 4403 | 4336 | 941.7 |
| A | 13 | 254 | 142075 | 146.27 | 4403 | 4336 | 941.7 |
| B | 10 | 245 | 3420244 | 4119.98 | 4409 | 4308 | 829.1 |
| B | 0 | 229 | 1226487 | 1474.08 | 4409 | 4308 | 829.1 |
| B | 5 | 255 | 480888 | 574.81 | 4409 | 4308 | 829.1 |
| C | 3 | 233 | 31886587 | 33151.39 | 4064 | 4058 | 961.7 |
| C | 10 | 9 | 456528 | 470.48 | 4064 | 4058 | 961.7 |
| C | 2 | 114 | 155189 | 157.15 | 4064 | 4058 | 961.7 |
| D | 8 | 195 | 15074538 | 16162.43 | 4084 | 3955 | 932.4 |
| D | 1 | 52 | 11235441 | 12045.2 | 4084 | 3955 | 932.4 |
| D | 12 | 33 | 5949103 | 6375.87 | 4084 | 3955 | 932.4 |
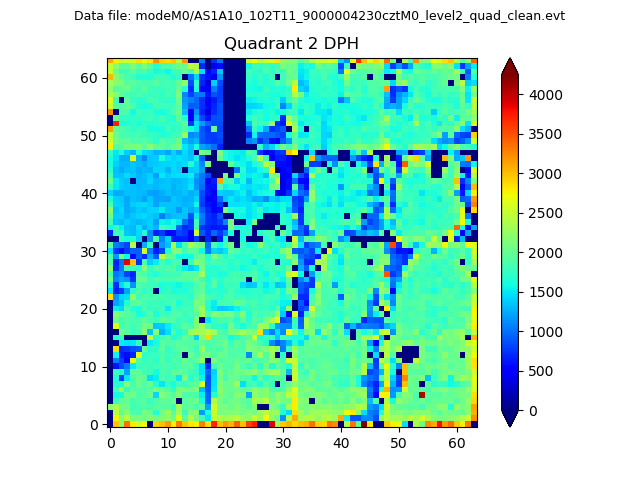
Histogram calculated using DETX and DETY for each event in the final _common_clean file
| Quadrant A |  |
 |
Quadrant B |
|---|---|---|---|
| Quadrant D |  |
 |
Quadrant C |
| Plot type | Count rate plots | Images |
|---|---|---|
| Comparison with Poisson distribution Blue bars denote a histogram of data divided into 1 sec bins. Red curve is a Poisson curve with rate = median count rate of data. |
 |
 |
| Quadrant-wise count rates Data is divided into 100 sec bins |
 |
|
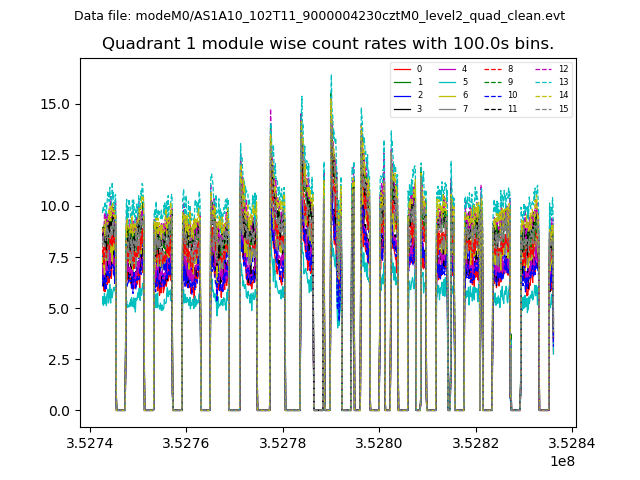
| Module-wise count rates for Quadrant A Data is divided into 100 sec bins |
 |
 |
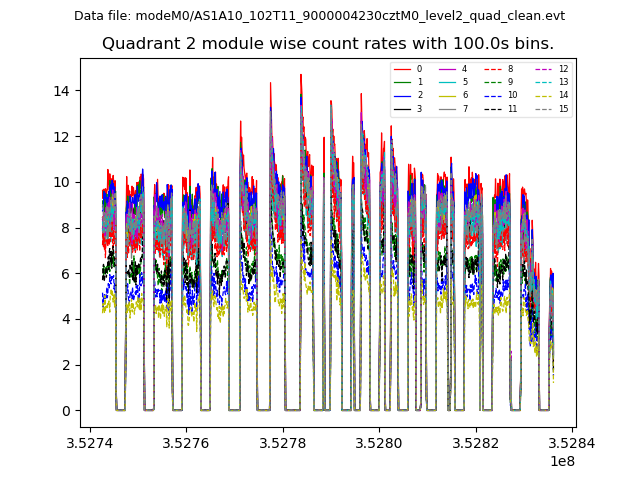
| Module-wise count rates for Quadrant B Data is divided into 100 sec bins |
 |
 |
| Module-wise count rates for Quadrant C Data is divided into 100 sec bins |
 |
 |
| Module-wise count rates for Quadrant D Data is divided into 100 sec bins |
 |
 |
| Parameter | Plot |
|---|---|
| CZT HV Monitor |  |
| D_VDD |  |
| Temperature 1 | 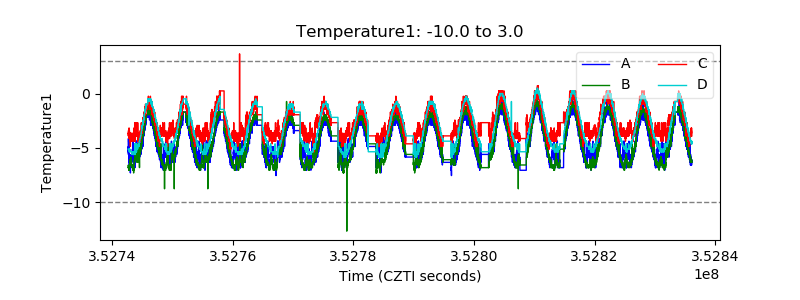 |
| Veto HV Monitor |  |
| Veto LLD |  |
| Alpha Counter |  |
| _CPM_Rate |  |
| CZT Counter |  |
| +2.5 Volts monitor | 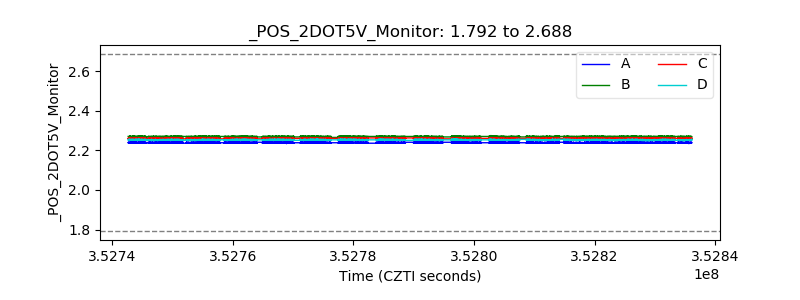 |
| +5 Volts monitor |  |
| _ROLL_ROT |  |
| _Roll_DEC |  |
| _Roll_RA |  |
| Veto Counter | 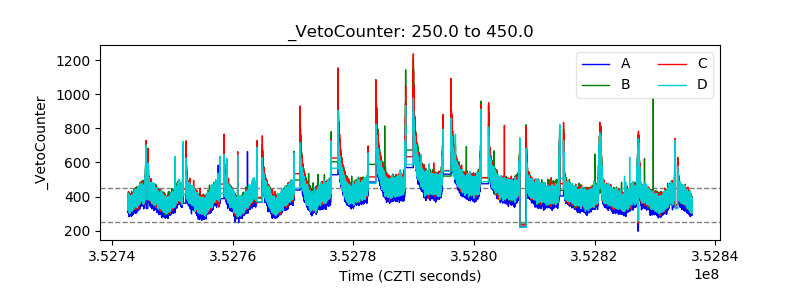 |