| Param | Original file | Final file |
|---|---|---|
| Filename | modeM0/AS1T03_282T01_9000004226cztM0_level2_bc.evt | modeM0/AS1T03_282T01_9000004226cztM0_level2_quad_clean.evt |
| Size (bytes) | 260,680,320 | 58,734,720 |
| Size | 248.6 MB | 56.0 MB |
| Events in quadrant A | 1,151,822 | 381,058 |
| Events in quadrant B | 1,124,773 | 385,899 |
| Events in quadrant C | 1,367,977 | 362,516 |
| Events in quadrant D | 3,932,378 | 328,496 |
| Mode SS | |||
|---|---|---|---|
| Quadrant | BADHDUFLAG | Total packets | Discarded packets |
| A | 0 | 92 | 0 |
| B | 0 | 92 | 0 |
| C | 0 | 92 | 0 |
| D | 0 | 92 | 0 |
| Mode M9 | |||
|---|---|---|---|
| Quadrant | BADHDUFLAG | Total packets | Discarded packets |
| A | 0 | 11 | 0 |
| B | 0 | 11 | 0 |
| C | 0 | 11 | 0 |
| D | 0 | 11 | 0 |
| Mode M0 | |||
|---|---|---|---|
| Quadrant | BADHDUFLAG | Total packets | Discarded packets |
| A | 0 | 9978 | 0 |
| B | 0 | 9936 | 0 |
| C | 0 | 11577 | 0 |
| D | 0 | 21643 | 0 |
| Quadrant | Total seconds | Saturated seconds | Saturation percentage |
|---|---|---|---|
| A | 4557 | 118 | 2.589423% |
| B | 4557 | 131 | 2.874698% |
| C | 4557 | 441 | 9.677419% |
| D | 4557 | 1218 | 26.728111% |
Noise dominated data is calculated using 1-second bins in cleaned event files. If a bin has >2000 counts, and if more than 50% of those come from <1% of pixels, then it is considered to be noise-dominated and hence unusable.
| Quadrant | # 1 sec bins | Bins with >0 counts | Bins with >2000 counts | High rate bins dominated by noise | Noise dominated (total time) | Noise dominated (detector-on time) | Marked lightcurve |
|---|---|---|---|---|---|---|---|
| A | 5582 | 4557 | 12 | 12 | 0.21% | 0.26% |  |
| B | 5582 | 4557 | 4 | 4 | 0.07% | 0.09% | 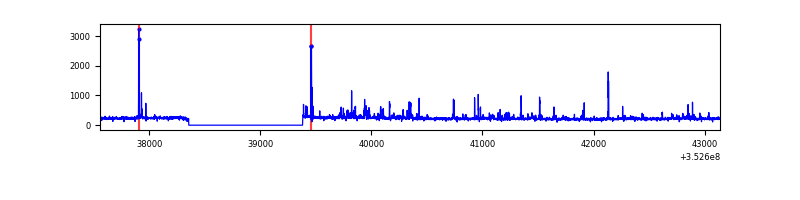 |
| C | 5582 | 4557 | 0 | 0 | 0.00% | 0.00% |  |
| D | 5582 | 4555 | 180 | 180 | 3.22% | 3.95% |  |
Top three noisy pixels from each quadrant. If the there are fewer than three noisy pixels in the level2.evt file, extra rows are filled as -1
| Pixel properties | Quadrant properties | ||||||
|---|---|---|---|---|---|---|---|
| Quadrant | DetID | PixID | Counts | Sigma | Mean | Median | Sigma |
| A | 1 | 113 | 143143 | 2507.38 | 256 | 251 | 57.0 |
| A | 15 | 174 | 15169 | 261.77 | 256 | 251 | 57.0 |
| A | 13 | 254 | 8974 | 153.07 | 256 | 251 | 57.0 |
| B | 5 | 255 | 49719 | 965.99 | 257 | 252 | 51.2 |
| B | 0 | 229 | 25269 | 488.53 | 257 | 252 | 51.2 |
| B | 0 | 190 | 18032 | 347.21 | 257 | 252 | 51.2 |
| C | 3 | 233 | 344394 | 5758.77 | 241 | 241 | 59.8 |
| C | 14 | 254 | 55851 | 930.53 | 241 | 241 | 59.8 |
| C | 4 | 175 | 24610 | 407.77 | 241 | 241 | 59.8 |
| D | 1 | 52 | 1985793 | 36342.99 | 227 | 219 | 54.6 |
| D | 12 | 227 | 508711 | 9307.19 | 227 | 219 | 54.6 |
| D | 8 | 195 | 206446 | 3774.68 | 227 | 219 | 54.6 |
Histogram calculated using DETX and DETY for each event in the final _common_clean file
| Quadrant A |  |
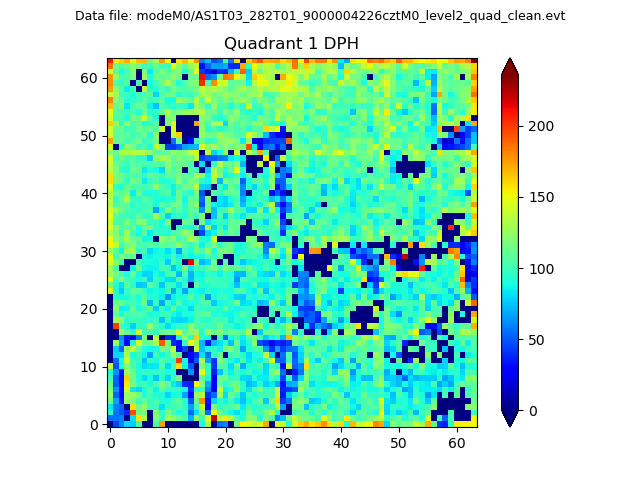 |
Quadrant B |
|---|---|---|---|
| Quadrant D |  |
 |
Quadrant C |
| Plot type | Count rate plots | Images |
|---|---|---|
| Comparison with Poisson distribution Blue bars denote a histogram of data divided into 1 sec bins. Red curve is a Poisson curve with rate = median count rate of data. |
 |
 |
| Quadrant-wise count rates Data is divided into 100 sec bins |
 |
|
| Module-wise count rates for Quadrant A Data is divided into 100 sec bins |
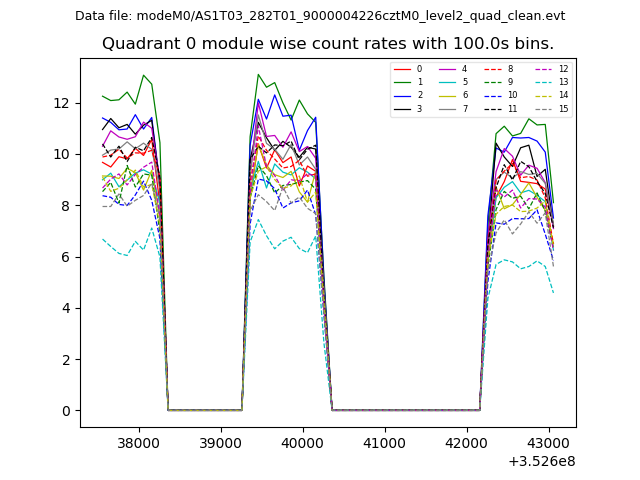 |
 |
| Module-wise count rates for Quadrant B Data is divided into 100 sec bins |
 |
 |
| Module-wise count rates for Quadrant C Data is divided into 100 sec bins |
 |
 |
| Module-wise count rates for Quadrant D Data is divided into 100 sec bins |
 |
 |
| Parameter | Plot |
|---|---|
| CZT HV Monitor |  |
| D_VDD |  |
| Temperature 1 |  |
| Veto HV Monitor |  |
| Veto LLD |  |
| Alpha Counter |  |
| _CPM_Rate |  |
| CZT Counter | 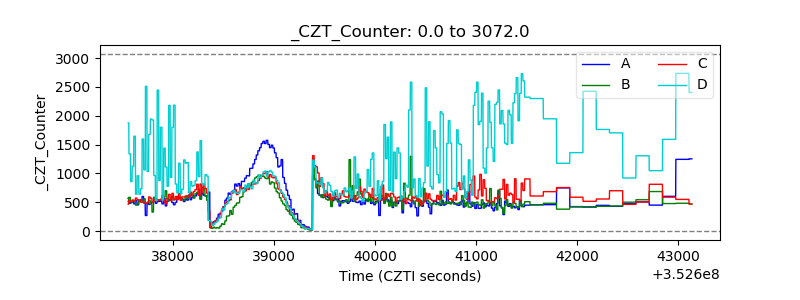 |
| +2.5 Volts monitor |  |
| +5 Volts monitor | 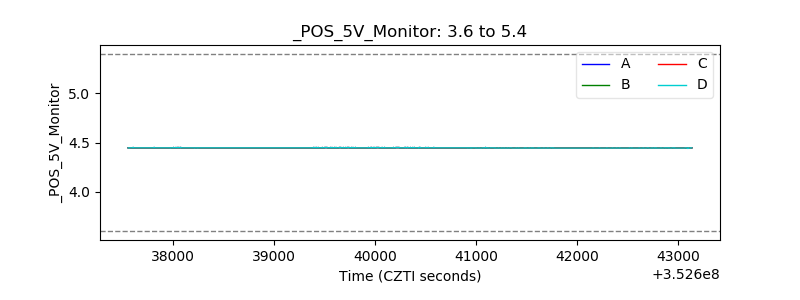 |
| _ROLL_ROT |  |
| _Roll_DEC |  |
| _Roll_RA | 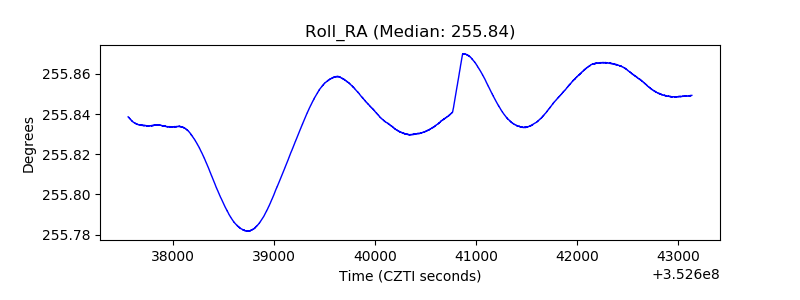 |
| Veto Counter |  |