| Param | Original file | Final file |
|---|---|---|
| Filename | modeM0/AS1T03_280T01_9000004222cztM0_level2_bc.evt | modeM0/AS1T03_280T01_9000004222cztM0_level2_quad_clean.evt |
| Size (bytes) | 1,352,891,520 | 327,836,160 |
| Size | 1.3 GB | 312.6 MB |
| Events in quadrant A | 5,551,593 | 2,186,659 |
| Events in quadrant B | 6,626,611 | 2,218,673 |
| Events in quadrant C | 7,195,267 | 2,136,523 |
| Events in quadrant D | 19,994,707 | 1,767,855 |
| Mode M9 | |||
|---|---|---|---|
| Quadrant | BADHDUFLAG | Total packets | Discarded packets |
| A | 0 | 49 | 0 |
| B | 0 | 49 | 0 |
| C | 0 | 49 | 0 |
| D | 0 | 49 | 0 |
| Mode M0 | |||
|---|---|---|---|
| Quadrant | BADHDUFLAG | Total packets | Discarded packets |
| A | 0 | 49690 | 0 |
| B | 0 | 53934 | 0 |
| C | 0 | 57893 | 0 |
| D | 0 | 108430 | 0 |
| Mode SS | |||
|---|---|---|---|
| Quadrant | BADHDUFLAG | Total packets | Discarded packets |
| A | 0 | 480 | 0 |
| B | 0 | 480 | 0 |
| C | 0 | 480 | 0 |
| D | 0 | 480 | 0 |
| Quadrant | Total seconds | Saturated seconds | Saturation percentage |
|---|---|---|---|
| A | 23515 | 110 | 0.467787% |
| B | 23515 | 430 | 1.828620% |
| C | 23515 | 581 | 2.470763% |
| D | 23515 | 5923 | 25.188178% |
Noise dominated data is calculated using 1-second bins in cleaned event files. If a bin has >2000 counts, and if more than 50% of those come from <1% of pixels, then it is considered to be noise-dominated and hence unusable.
| Quadrant | # 1 sec bins | Bins with >0 counts | Bins with >2000 counts | High rate bins dominated by noise | Noise dominated (total time) | Noise dominated (detector-on time) | Marked lightcurve |
|---|---|---|---|---|---|---|---|
| A | 28455 | 23515 | 2 | 2 | 0.01% | 0.01% |  |
| B | 28455 | 23515 | 49 | 49 | 0.17% | 0.21% |  |
| C | 28455 | 23515 | 1 | 1 | 0.00% | 0.00% |  |
| D | 28455 | 23514 | 633 | 633 | 2.22% | 2.69% |  |
Top three noisy pixels from each quadrant. If the there are fewer than three noisy pixels in the level2.evt file, extra rows are filled as -1
| Pixel properties | Quadrant properties | ||||||
|---|---|---|---|---|---|---|---|
| Quadrant | DetID | PixID | Counts | Sigma | Mean | Median | Sigma |
| A | 15 | 174 | 60512 | 195.16 | 1420 | 1401 | 302.9 |
| A | 13 | 254 | 45554 | 145.77 | 1420 | 1401 | 302.9 |
| A | 1 | 113 | 9432 | 26.51 | 1420 | 1401 | 302.9 |
| B | 10 | 245 | 556562 | 2094.38 | 1424 | 1400 | 265.1 |
| B | 0 | 229 | 238953 | 896.18 | 1424 | 1400 | 265.1 |
| B | 5 | 255 | 168441 | 630.17 | 1424 | 1400 | 265.1 |
| C | 3 | 233 | 1662067 | 5029.82 | 1385 | 1388 | 330.2 |
| C | 4 | 175 | 52845 | 155.85 | 1385 | 1388 | 330.2 |
| C | 2 | 114 | 47179 | 138.69 | 1385 | 1388 | 330.2 |
| D | 12 | 33 | 8197536 | 28551.9 | 1256 | 1223 | 287.1 |
| D | 1 | 52 | 4746976 | 16531.85 | 1256 | 1223 | 287.1 |
| D | 8 | 195 | 823153 | 2863.2 | 1256 | 1223 | 287.1 |
Histogram calculated using DETX and DETY for each event in the final _common_clean file
| Quadrant A |  |
 |
Quadrant B |
|---|---|---|---|
| Quadrant D | 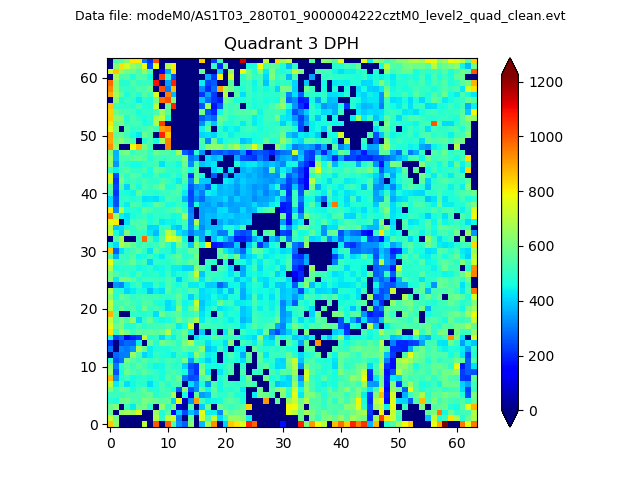 |
 |
Quadrant C |
| Plot type | Count rate plots | Images |
|---|---|---|
| Comparison with Poisson distribution Blue bars denote a histogram of data divided into 1 sec bins. Red curve is a Poisson curve with rate = median count rate of data. |
 |
 |
| Quadrant-wise count rates Data is divided into 100 sec bins |
 |
|
| Module-wise count rates for Quadrant A Data is divided into 100 sec bins |
 |
 |
| Module-wise count rates for Quadrant B Data is divided into 100 sec bins |
 |
 |
| Module-wise count rates for Quadrant C Data is divided into 100 sec bins |
 |
 |
| Module-wise count rates for Quadrant D Data is divided into 100 sec bins |
 |
 |
| Parameter | Plot |
|---|---|
| CZT HV Monitor |  |
| D_VDD |  |
| Temperature 1 |  |
| Veto HV Monitor |  |
| Veto LLD |  |
| Alpha Counter |  |
| _CPM_Rate |  |
| CZT Counter |  |
| +2.5 Volts monitor |  |
| +5 Volts monitor |  |
| _ROLL_ROT |  |
| _Roll_DEC |  |
| _Roll_RA | 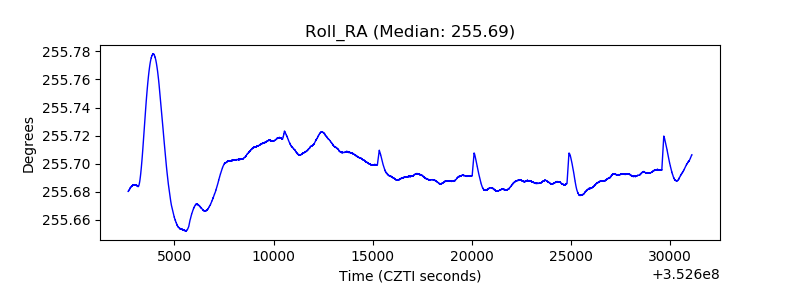 |
| Veto Counter |  |