| Param | Original file | Final file |
|---|---|---|
| Filename | modeM0/AS1T03_279T01_9000004218cztM0_level2_bc.evt | modeM0/AS1T03_279T01_9000004218cztM0_level2_quad_clean.evt |
| Size (bytes) | 12,579,632,640 | 2,785,599,360 |
| Size | 11.7 GB | 2.6 GB |
| Events in quadrant A | 49,376,329 | 18,749,625 |
| Events in quadrant B | 52,036,871 | 18,936,671 |
| Events in quadrant C | 87,343,229 | 17,718,451 |
| Events in quadrant D | 178,341,436 | 14,966,569 |
| Mode SS | |||
|---|---|---|---|
| Quadrant | BADHDUFLAG | Total packets | Discarded packets |
| A | 0 | 4154 | 0 |
| B | 0 | 4154 | 0 |
| C | 0 | 4154 | 0 |
| D | 0 | 4154 | 0 |
| Mode M9 | |||
|---|---|---|---|
| Quadrant | BADHDUFLAG | Total packets | Discarded packets |
| A | 0 | 329 | 0 |
| B | 0 | 329 | 0 |
| C | 0 | 329 | 0 |
| D | 0 | 329 | 0 |
| Mode M0 | |||
|---|---|---|---|
| Quadrant | BADHDUFLAG | Total packets | Discarded packets |
| A | 0 | 440134 | 0 |
| B | 0 | 454184 | 0 |
| C | 0 | 579515 | 0 |
| D | 0 | 996439 | 0 |
| Quadrant | Total seconds | Saturated seconds | Saturation percentage |
|---|---|---|---|
| A | 204251 | 3548 | 1.737078% |
| B | 204251 | 4344 | 2.126795% |
| C | 204252 | 15455 | 7.566633% |
| D | 204252 | 68911 | 33.738225% |
Noise dominated data is calculated using 1-second bins in cleaned event files. If a bin has >2000 counts, and if more than 50% of those come from <1% of pixels, then it is considered to be noise-dominated and hence unusable.
| Quadrant | # 1 sec bins | Bins with >0 counts | Bins with >2000 counts | High rate bins dominated by noise | Noise dominated (total time) | Noise dominated (detector-on time) | Marked lightcurve |
|---|---|---|---|---|---|---|---|
| A | 242231 | 204262 | 482 | 482 | 0.20% | 0.24% |  |
| B | 242231 | 204258 | 85 | 85 | 0.04% | 0.04% |  |
| C | 242231 | 204235 | 818 | 818 | 0.34% | 0.40% |  |
| D | 242231 | 204116 | 10506 | 10506 | 4.34% | 5.15% |  |
Top three noisy pixels from each quadrant. If the there are fewer than three noisy pixels in the level2.evt file, extra rows are filled as -1
| Pixel properties | Quadrant properties | ||||||
|---|---|---|---|---|---|---|---|
| Quadrant | DetID | PixID | Counts | Sigma | Mean | Median | Sigma |
| A | 1 | 113 | 1941817 | 771.57 | 11545 | 11367 | 2502.0 |
| A | 14 | 235 | 1410713 | 559.3 | 11545 | 11367 | 2502.0 |
| A | 15 | 174 | 758537 | 298.63 | 11545 | 11367 | 2502.0 |
| B | 10 | 245 | 2612565 | 1200.28 | 11541 | 11324 | 2167.2 |
| B | 5 | 172 | 1428968 | 654.14 | 11541 | 11324 | 2167.2 |
| B | 0 | 229 | 866038 | 394.39 | 11541 | 11324 | 2167.2 |
| C | 3 | 233 | 33333823 | 12815.44 | 10921 | 10941 | 2600.2 |
| C | 10 | 9 | 10451739 | 4015.36 | 10921 | 10941 | 2600.2 |
| C | 14 | 254 | 617468 | 233.26 | 10921 | 10941 | 2600.2 |
| D | 1 | 52 | 53467047 | 24242.82 | 9505 | 9217 | 2205.1 |
| D | 12 | 33 | 47074824 | 21343.98 | 9505 | 9217 | 2205.1 |
| D | 7 | 80 | 17672939 | 8010.4 | 9505 | 9217 | 2205.1 |
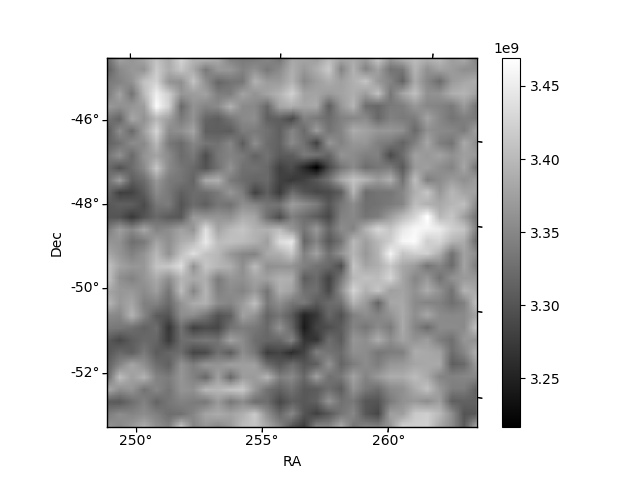
Histogram calculated using DETX and DETY for each event in the final _common_clean file
| Quadrant A |  |
 |
Quadrant B |
|---|---|---|---|
| Quadrant D |  |
 |
Quadrant C |
| Plot type | Count rate plots | Images |
|---|---|---|
| Comparison with Poisson distribution Blue bars denote a histogram of data divided into 1 sec bins. Red curve is a Poisson curve with rate = median count rate of data. |
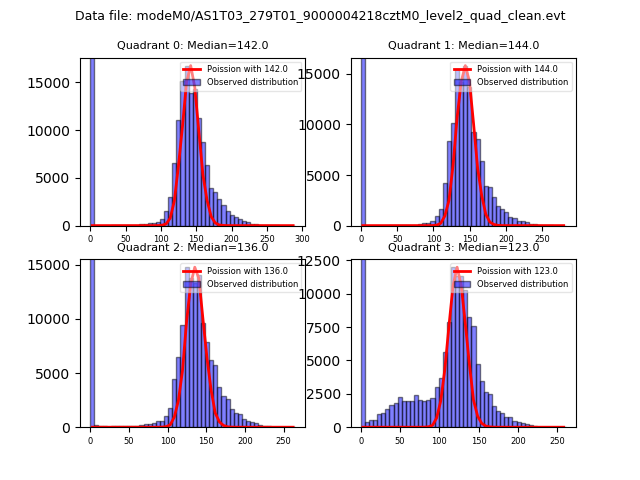 |
 |
| Quadrant-wise count rates Data is divided into 100 sec bins |
 |
|
| Module-wise count rates for Quadrant A Data is divided into 100 sec bins |
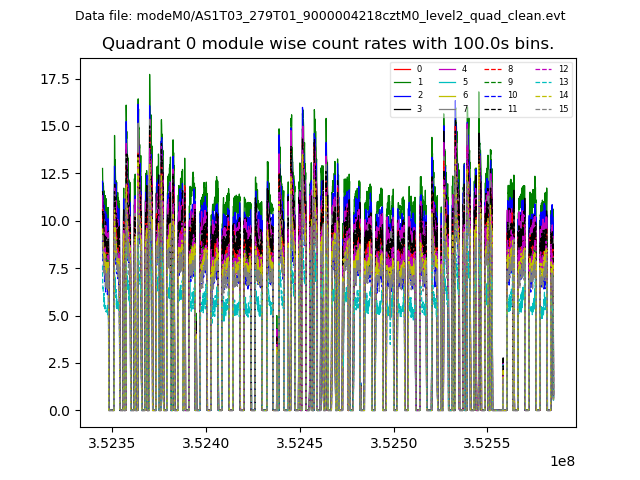 |
 |
| Module-wise count rates for Quadrant B Data is divided into 100 sec bins |
 |
 |
| Module-wise count rates for Quadrant C Data is divided into 100 sec bins |
 |
 |
| Module-wise count rates for Quadrant D Data is divided into 100 sec bins |
 |
 |
| Parameter | Plot |
|---|---|
| CZT HV Monitor | 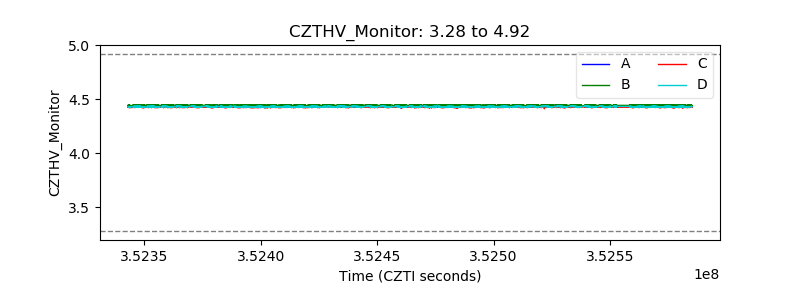 |
| D_VDD | 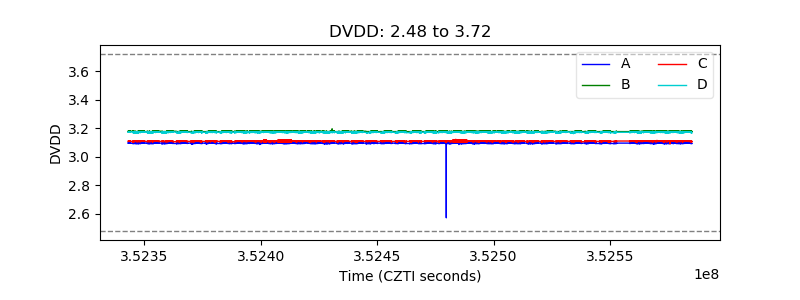 |
| Temperature 1 |  |
| Veto HV Monitor |  |
| Veto LLD |  |
| Alpha Counter |  |
| _CPM_Rate |  |
| CZT Counter |  |
| +2.5 Volts monitor | 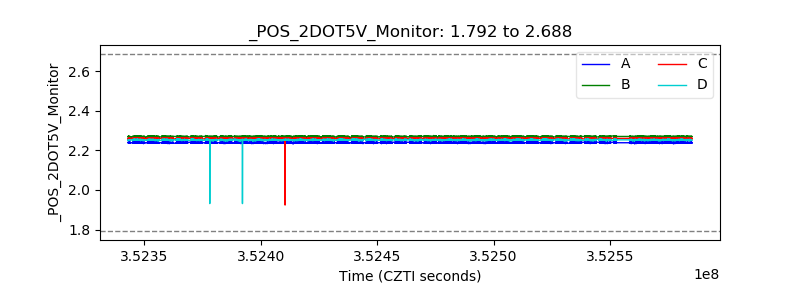 |
| +5 Volts monitor |  |
| _ROLL_ROT |  |
| _Roll_DEC | 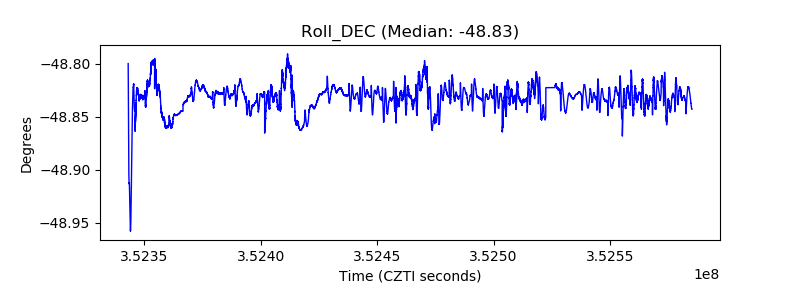 |
| _Roll_RA |  |
| Veto Counter |  |