| Param | Original file | Final file |
|---|---|---|
| Filename | modeM0/AS1A10_083T01_9000004214cztM0_level2_bc.evt | modeM0/AS1A10_083T01_9000004214cztM0_level2_quad_clean.evt |
| Size (bytes) | 2,116,949,760 | 330,289,920 |
| Size | 2.0 GB | 315.0 MB |
| Events in quadrant A | 7,940,797 | 2,220,846 |
| Events in quadrant B | 7,492,980 | 2,251,340 |
| Events in quadrant C | 31,548,115 | 1,850,507 |
| Events in quadrant D | 15,485,991 | 2,012,660 |
| Mode SS | |||
|---|---|---|---|
| Quadrant | BADHDUFLAG | Total packets | Discarded packets |
| A | 0 | 490 | 0 |
| B | 0 | 490 | 0 |
| C | 0 | 490 | 0 |
| D | 0 | 490 | 0 |
| Mode M9 | |||
|---|---|---|---|
| Quadrant | BADHDUFLAG | Total packets | Discarded packets |
| A | 0 | 53 | 0 |
| B | 0 | 53 | 0 |
| C | 0 | 53 | 0 |
| D | 0 | 53 | 0 |
| Mode M0 | |||
|---|---|---|---|
| Quadrant | BADHDUFLAG | Total packets | Discarded packets |
| A | 0 | 59322 | 0 |
| B | 0 | 59008 | 0 |
| C | 0 | 136715 | 0 |
| D | 0 | 88092 | 0 |
| Quadrant | Total seconds | Saturated seconds | Saturation percentage |
|---|---|---|---|
| A | 24218 | 785 | 3.241391% |
| B | 24218 | 809 | 3.340491% |
| C | 24218 | 10629 | 43.888843% |
| D | 24218 | 2139 | 8.832274% |
Noise dominated data is calculated using 1-second bins in cleaned event files. If a bin has >2000 counts, and if more than 50% of those come from <1% of pixels, then it is considered to be noise-dominated and hence unusable.
| Quadrant | # 1 sec bins | Bins with >0 counts | Bins with >2000 counts | High rate bins dominated by noise | Noise dominated (total time) | Noise dominated (detector-on time) | Marked lightcurve |
|---|---|---|---|---|---|---|---|
| A | 28323 | 24219 | 130 | 130 | 0.46% | 0.54% | 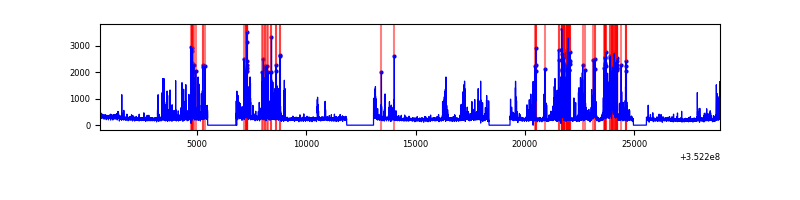 |
| B | 28322 | 24219 | 43 | 43 | 0.15% | 0.18% | 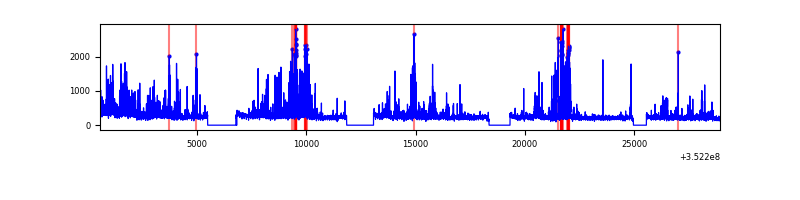 |
| C | 28322 | 24218 | 2193 | 2193 | 7.74% | 9.06% | 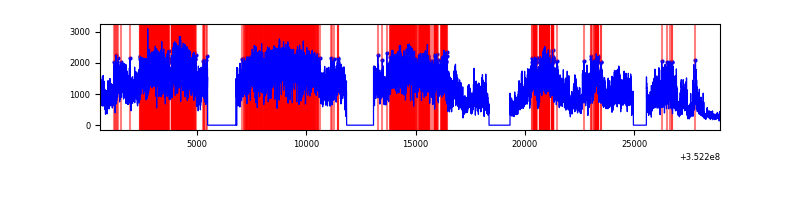 |
| D | 28321 | 24215 | 294 | 294 | 1.04% | 1.21% |  |
Top three noisy pixels from each quadrant. If the there are fewer than three noisy pixels in the level2.evt file, extra rows are filled as -1
| Pixel properties | Quadrant properties | ||||||
|---|---|---|---|---|---|---|---|
| Quadrant | DetID | PixID | Counts | Sigma | Mean | Median | Sigma |
| A | 14 | 235 | 1066376 | 3497.49 | 1408 | 1388 | 304.5 |
| A | 0 | 13 | 1022514 | 3353.44 | 1408 | 1388 | 304.5 |
| A | 1 | 113 | 301584 | 985.86 | 1408 | 1388 | 304.5 |
| B | 5 | 255 | 1221335 | 4633.38 | 1398 | 1372 | 263.3 |
| B | 0 | 190 | 440286 | 1666.98 | 1398 | 1372 | 263.3 |
| B | 5 | 172 | 138428 | 520.53 | 1398 | 1372 | 263.3 |
| C | 3 | 233 | 26992945 | 97235.64 | 1161 | 1160 | 277.6 |
| C | 2 | 114 | 43754 | 153.44 | 1161 | 1160 | 277.6 |
| C | 10 | 9 | 18501 | 62.47 | 1161 | 1160 | 277.6 |
| D | 1 | 52 | 4342753 | 14157.32 | 1338 | 1301 | 306.7 |
| D | 8 | 195 | 3028650 | 9872.08 | 1338 | 1301 | 306.7 |
| D | 7 | 80 | 1336112 | 4352.77 | 1338 | 1301 | 306.7 |
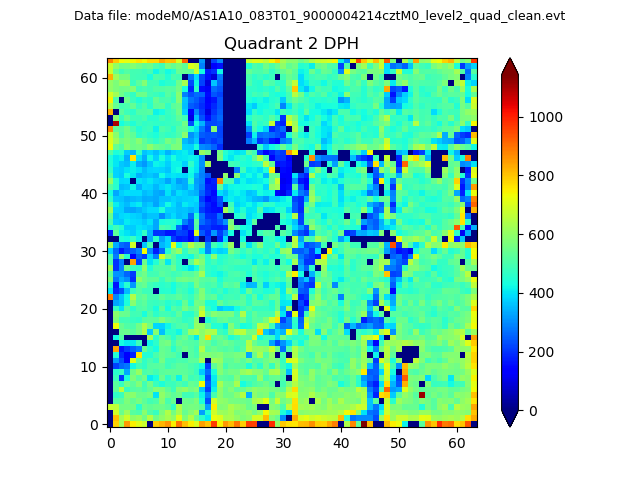
Histogram calculated using DETX and DETY for each event in the final _common_clean file
| Quadrant A | 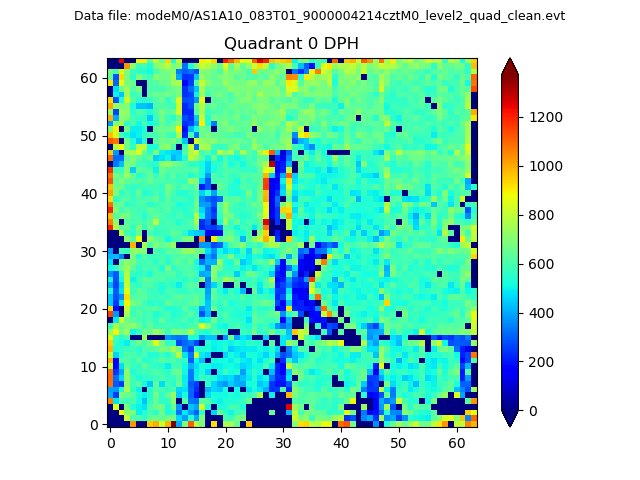 |
 |
Quadrant B |
|---|---|---|---|
| Quadrant D |  |
 |
Quadrant C |
| Plot type | Count rate plots | Images |
|---|---|---|
| Comparison with Poisson distribution Blue bars denote a histogram of data divided into 1 sec bins. Red curve is a Poisson curve with rate = median count rate of data. |
 |
 |
| Quadrant-wise count rates Data is divided into 100 sec bins |
 |
|
| Module-wise count rates for Quadrant A Data is divided into 100 sec bins |
 |
 |
| Module-wise count rates for Quadrant B Data is divided into 100 sec bins |
 |
 |
| Module-wise count rates for Quadrant C Data is divided into 100 sec bins |
 |
 |
| Module-wise count rates for Quadrant D Data is divided into 100 sec bins |
 |
 |
| Parameter | Plot |
|---|---|
| CZT HV Monitor |  |
| D_VDD |  |
| Temperature 1 |  |
| Veto HV Monitor |  |
| Veto LLD |  |
| Alpha Counter |  |
| _CPM_Rate |  |
| CZT Counter |  |
| +2.5 Volts monitor | 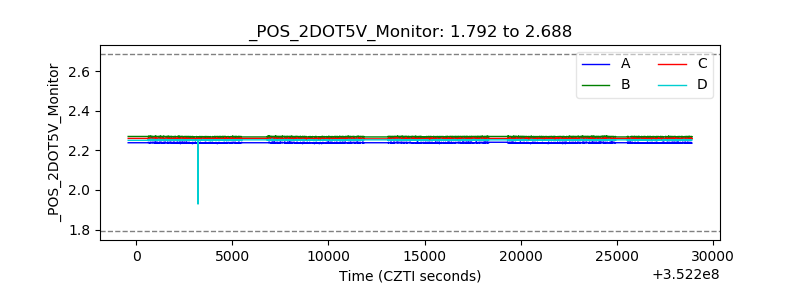 |
| +5 Volts monitor |  |
| _ROLL_ROT |  |
| _Roll_DEC |  |
| _Roll_RA |  |
| Veto Counter |  |