| Param | Original file | Final file |
|---|---|---|
| Filename | modeM0/AS1A10_050T03_9000004216cztM0_level2_bc.evt | modeM0/AS1A10_050T03_9000004216cztM0_level2_quad_clean.evt |
| Size (bytes) | 5,570,755,200 | 1,256,264,640 |
| Size | 5.2 GB | 1.2 GB |
| Events in quadrant A | 22,379,121 | 8,502,579 |
| Events in quadrant B | 30,958,467 | 8,443,641 |
| Events in quadrant C | 30,509,979 | 8,241,112 |
| Events in quadrant D | 78,076,742 | 6,035,940 |
| Mode M9 | |||
|---|---|---|---|
| Quadrant | BADHDUFLAG | Total packets | Discarded packets |
| A | 0 | 138 | 0 |
| B | 0 | 138 | 0 |
| C | 0 | 138 | 0 |
| D | 0 | 138 | 0 |
| Mode SS | |||
|---|---|---|---|
| Quadrant | BADHDUFLAG | Total packets | Discarded packets |
| A | 0 | 2022 | 0 |
| B | 0 | 2022 | 0 |
| C | 0 | 2022 | 0 |
| D | 0 | 2022 | 0 |
| Mode M0 | |||
|---|---|---|---|
| Quadrant | BADHDUFLAG | Total packets | Discarded packets |
| A | 0 | 210099 | 0 |
| B | 0 | 246184 | 0 |
| C | 0 | 242298 | 0 |
| D | 0 | 552342 | 0 |
| Quadrant | Total seconds | Saturated seconds | Saturation percentage |
|---|---|---|---|
| A | 99448 | 1213 | 1.219733% |
| B | 99448 | 4529 | 4.554139% |
| C | 99448 | 3265 | 3.283123% |
| D | 99448 | 51815 | 52.102606% |
Noise dominated data is calculated using 1-second bins in cleaned event files. If a bin has >2000 counts, and if more than 50% of those come from <1% of pixels, then it is considered to be noise-dominated and hence unusable.
| Quadrant | # 1 sec bins | Bins with >0 counts | Bins with >2000 counts | High rate bins dominated by noise | Noise dominated (total time) | Noise dominated (detector-on time) | Marked lightcurve |
|---|---|---|---|---|---|---|---|
| A | 113068 | 99449 | 36 | 36 | 0.03% | 0.04% |  |
| B | 113068 | 99443 | 459 | 459 | 0.41% | 0.46% |  |
| C | 113068 | 99449 | 22 | 22 | 0.02% | 0.02% |  |
| D | 113068 | 99369 | 993 | 993 | 0.88% | 1.00% |  |
Top three noisy pixels from each quadrant. If the there are fewer than three noisy pixels in the level2.evt file, extra rows are filled as -1
| Pixel properties | Quadrant properties | ||||||
|---|---|---|---|---|---|---|---|
| Quadrant | DetID | PixID | Counts | Sigma | Mean | Median | Sigma |
| A | 14 | 235 | 523960 | 442.99 | 5427 | 5340 | 1170.7 |
| A | 1 | 113 | 324935 | 272.99 | 5427 | 5340 | 1170.7 |
| A | 15 | 174 | 298697 | 250.58 | 5427 | 5340 | 1170.7 |
| B | 10 | 245 | 6638341 | 6535.74 | 5342 | 5207 | 1014.9 |
| B | 0 | 190 | 975167 | 955.72 | 5342 | 5207 | 1014.9 |
| B | 5 | 172 | 852038 | 834.4 | 5342 | 5207 | 1014.9 |
| C | 3 | 233 | 9617474 | 7788.5 | 5202 | 5195 | 1234.2 |
| C | 10 | 9 | 250043 | 198.39 | 5202 | 5195 | 1234.2 |
| C | 2 | 114 | 201030 | 158.68 | 5202 | 5195 | 1234.2 |
| D | 12 | 33 | 38398492 | 43077.1 | 3810 | 3686 | 891.3 |
| D | 1 | 52 | 10849846 | 12168.86 | 3810 | 3686 | 891.3 |
| D | 8 | 195 | 5744493 | 6440.9 | 3810 | 3686 | 891.3 |
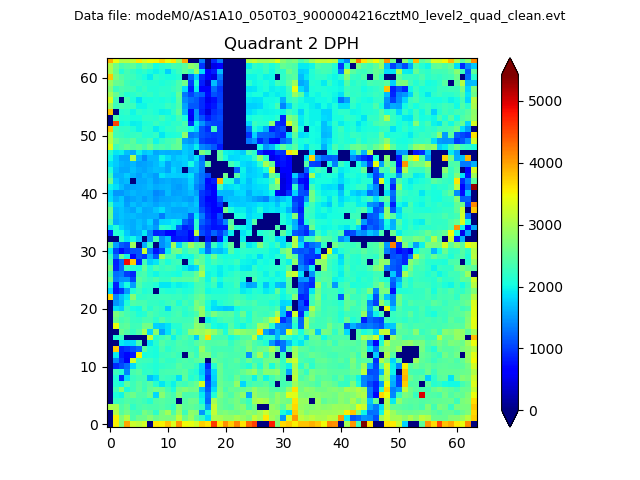
Histogram calculated using DETX and DETY for each event in the final _common_clean file
| Quadrant A |  |
 |
Quadrant B |
|---|---|---|---|
| Quadrant D |  |
 |
Quadrant C |
| Plot type | Count rate plots | Images |
|---|---|---|
| Comparison with Poisson distribution Blue bars denote a histogram of data divided into 1 sec bins. Red curve is a Poisson curve with rate = median count rate of data. |
 |
 |
| Quadrant-wise count rates Data is divided into 100 sec bins |
 |
|
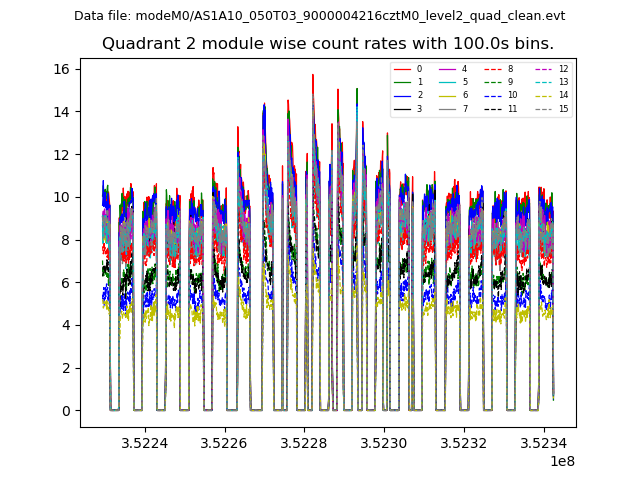
| Module-wise count rates for Quadrant A Data is divided into 100 sec bins |
 |
 |
| Module-wise count rates for Quadrant B Data is divided into 100 sec bins |
 |
 |
| Module-wise count rates for Quadrant C Data is divided into 100 sec bins |
 |
 |
| Module-wise count rates for Quadrant D Data is divided into 100 sec bins |
 |
 |
| Parameter | Plot |
|---|---|
| CZT HV Monitor |  |
| D_VDD |  |
| Temperature 1 | 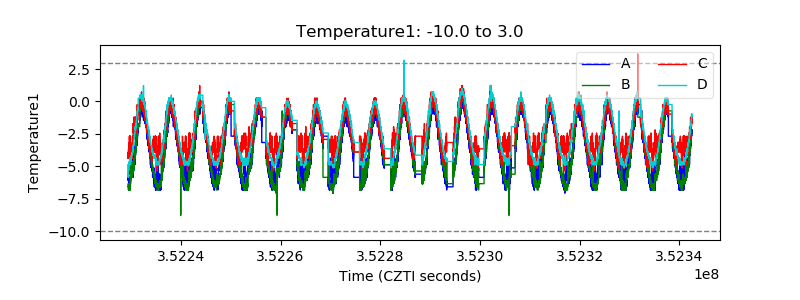 |
| Veto HV Monitor |  |
| Veto LLD | 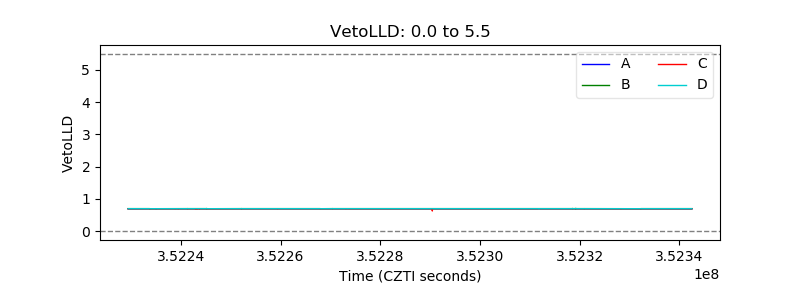 |
| Alpha Counter |  |
| _CPM_Rate | 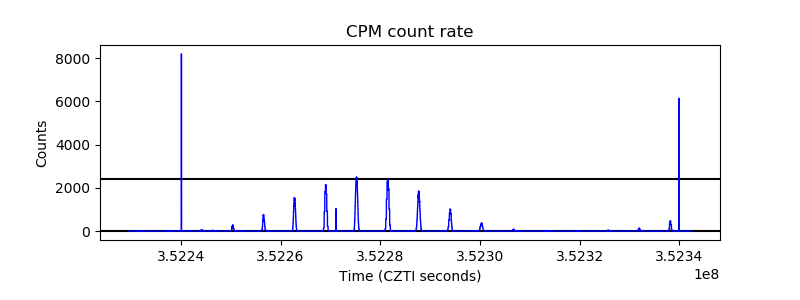 |
| CZT Counter | 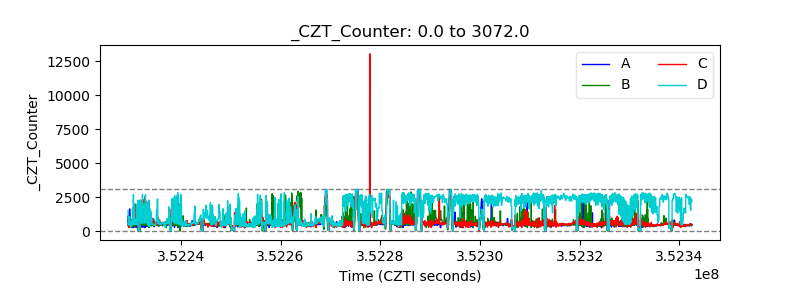 |
| +2.5 Volts monitor | 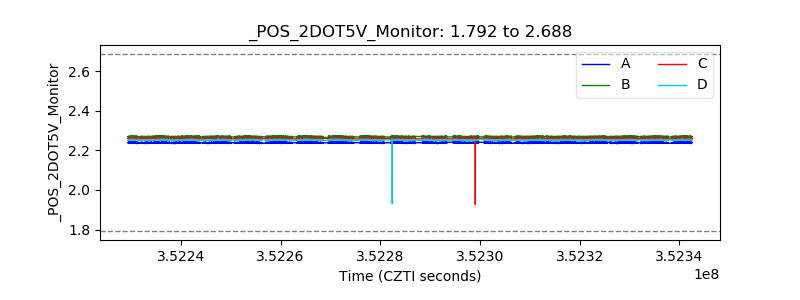 |
| +5 Volts monitor |  |
| _ROLL_ROT |  |
| _Roll_DEC | 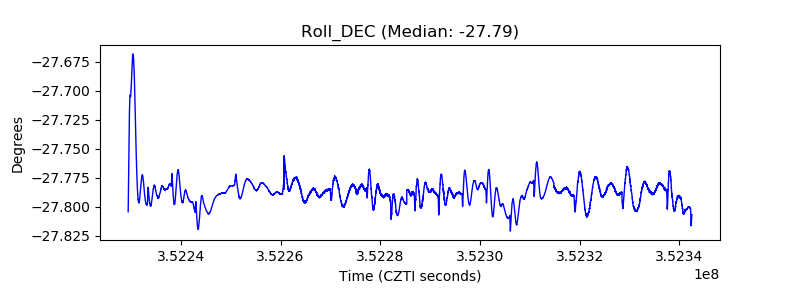 |
| _Roll_RA |  |
| Veto Counter | 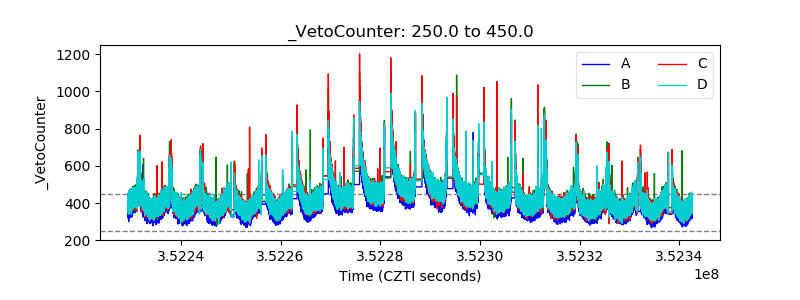 |