| Param | Original file | Final file |
|---|---|---|
| Filename | modeM0/AS1A10_050T01_9000004212cztM0_level2_bc.evt | modeM0/AS1A10_050T01_9000004212cztM0_level2_quad_clean.evt |
| Size (bytes) | 8,810,144,640 | 1,369,768,320 |
| Size | 8.2 GB | 1.3 GB |
| Events in quadrant A | 23,815,168 | 9,070,209 |
| Events in quadrant B | 30,782,720 | 9,036,052 |
| Events in quadrant C | 127,392,767 | 7,722,206 |
| Events in quadrant D | 77,504,156 | 8,246,595 |
| Mode M9 | |||
|---|---|---|---|
| Quadrant | BADHDUFLAG | Total packets | Discarded packets |
| A | 0 | 144 | 0 |
| B | 0 | 144 | 0 |
| C | 0 | 144 | 0 |
| D | 0 | 144 | 0 |
| Mode M0 | |||
|---|---|---|---|
| Quadrant | BADHDUFLAG | Total packets | Discarded packets |
| A | 0 | 226957 | 0 |
| B | 0 | 256754 | 0 |
| C | 0 | 569222 | 0 |
| D | 0 | 427619 | 0 |
| Mode SS | |||
|---|---|---|---|
| Quadrant | BADHDUFLAG | Total packets | Discarded packets |
| A | 0 | 2202 | 0 |
| B | 0 | 2202 | 0 |
| C | 0 | 2202 | 0 |
| D | 0 | 2202 | 0 |
| Quadrant | Total seconds | Saturated seconds | Saturation percentage |
|---|---|---|---|
| A | 108022 | 1234 | 1.142360% |
| B | 108022 | 3963 | 3.668697% |
| C | 108021 | 46572 | 43.113839% |
| D | 108023 | 16281 | 15.071790% |
Noise dominated data is calculated using 1-second bins in cleaned event files. If a bin has >2000 counts, and if more than 50% of those come from <1% of pixels, then it is considered to be noise-dominated and hence unusable.
| Quadrant | # 1 sec bins | Bins with >0 counts | Bins with >2000 counts | High rate bins dominated by noise | Noise dominated (total time) | Noise dominated (detector-on time) | Marked lightcurve |
|---|---|---|---|---|---|---|---|
| A | 139482 | 108028 | 31 | 31 | 0.02% | 0.03% |  |
| B | 139482 | 108020 | 209 | 209 | 0.15% | 0.19% |  |
| C | 139482 | 108008 | 9947 | 9947 | 7.13% | 9.21% |  |
| D | 139482 | 108015 | 2817 | 2817 | 2.02% | 2.61% | 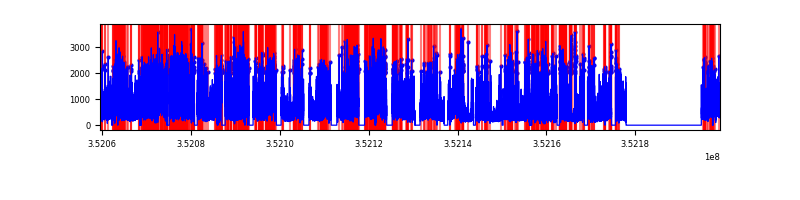 |
Top three noisy pixels from each quadrant. If the there are fewer than three noisy pixels in the level2.evt file, extra rows are filled as -1
| Pixel properties | Quadrant properties | ||||||
|---|---|---|---|---|---|---|---|
| Quadrant | DetID | PixID | Counts | Sigma | Mean | Median | Sigma |
| A | 0 | 13 | 652826 | 507.23 | 5933 | 5827 | 1275.5 |
| A | 13 | 254 | 217306 | 165.8 | 5933 | 5827 | 1275.5 |
| A | 15 | 174 | 88288 | 64.65 | 5933 | 5827 | 1275.5 |
| B | 5 | 255 | 3950658 | 3559.89 | 5876 | 5735 | 1108.2 |
| B | 10 | 245 | 2578803 | 2321.93 | 5876 | 5735 | 1108.2 |
| B | 5 | 172 | 426608 | 379.79 | 5876 | 5735 | 1108.2 |
| C | 3 | 233 | 107988324 | 94452.73 | 4797 | 4781 | 1143.3 |
| C | 14 | 254 | 501813 | 434.75 | 4797 | 4781 | 1143.3 |
| C | 2 | 114 | 188395 | 160.61 | 4797 | 4781 | 1143.3 |
| D | 1 | 52 | 27854224 | 22036.48 | 5507 | 5337 | 1263.8 |
| D | 8 | 195 | 13564477 | 10729.18 | 5507 | 5337 | 1263.8 |
| D | 12 | 233 | 5034964 | 3979.88 | 5507 | 5337 | 1263.8 |
Histogram calculated using DETX and DETY for each event in the final _common_clean file
| Quadrant A | 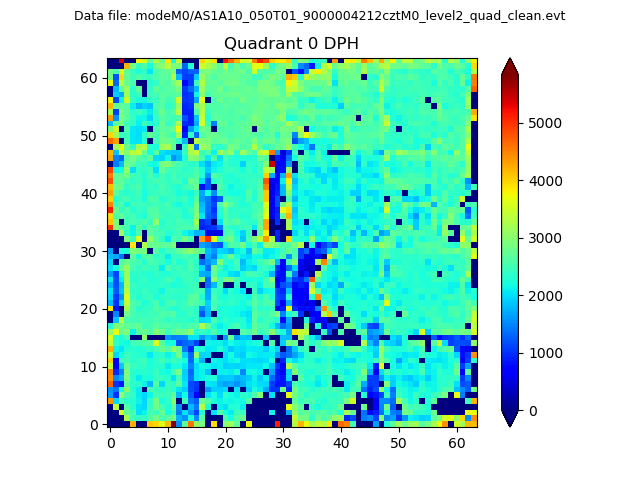 |
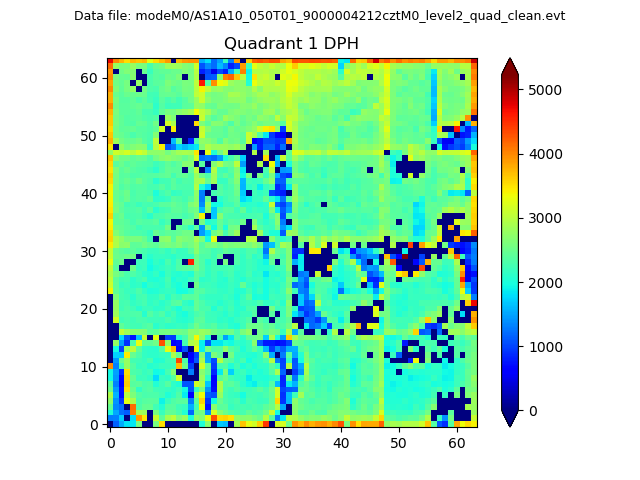 |
Quadrant B |
|---|---|---|---|
| Quadrant D |  |
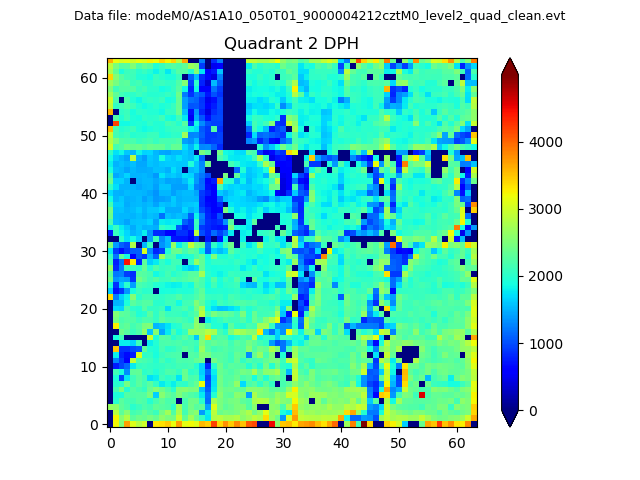 |
Quadrant C |
| Plot type | Count rate plots | Images |
|---|---|---|
| Comparison with Poisson distribution Blue bars denote a histogram of data divided into 1 sec bins. Red curve is a Poisson curve with rate = median count rate of data. |
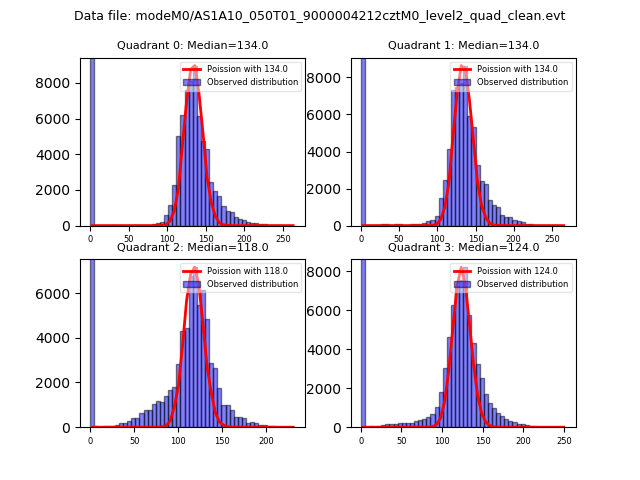 |
 |
| Quadrant-wise count rates Data is divided into 100 sec bins |
 |
|
| Module-wise count rates for Quadrant A Data is divided into 100 sec bins |
 |
 |
| Module-wise count rates for Quadrant B Data is divided into 100 sec bins |
 |
 |
| Module-wise count rates for Quadrant C Data is divided into 100 sec bins |
 |
 |
| Module-wise count rates for Quadrant D Data is divided into 100 sec bins |
 |
 |
| Parameter | Plot |
|---|---|
| CZT HV Monitor |  |
| D_VDD |  |
| Temperature 1 | 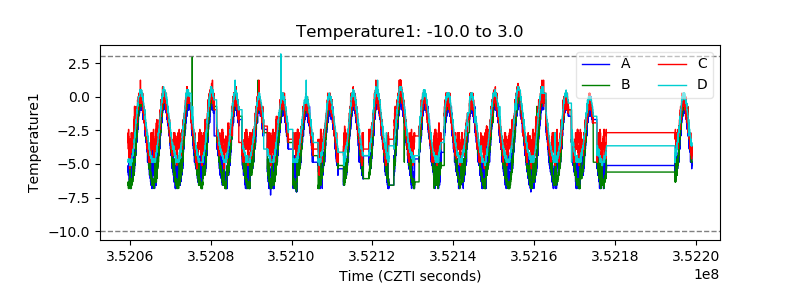 |
| Veto HV Monitor |  |
| Veto LLD |  |
| Alpha Counter |  |
| _CPM_Rate |  |
| CZT Counter | 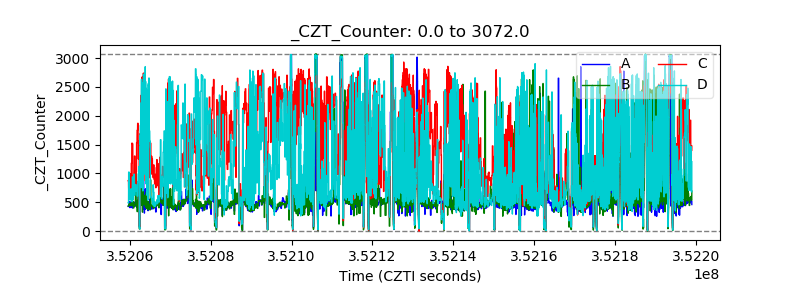 |
| +2.5 Volts monitor |  |
| +5 Volts monitor |  |
| _ROLL_ROT |  |
| _Roll_DEC |  |
| _Roll_RA |  |
| Veto Counter |  |