| Param | Original file | Final file |
|---|---|---|
| Filename | modeM0/AS1A10_021T10_9000004210cztM0_level2_bc.evt | modeM0/AS1A10_021T10_9000004210cztM0_level2_quad_clean.evt |
| Size (bytes) | 1,894,870,080 | 506,399,040 |
| Size | 1.8 GB | 482.9 MB |
| Events in quadrant A | 7,728,979 | 3,434,316 |
| Events in quadrant B | 9,417,630 | 3,443,586 |
| Events in quadrant C | 11,927,187 | 3,131,030 |
| Events in quadrant D | 26,027,646 | 3,022,173 |
| Mode SS | |||
|---|---|---|---|
| Quadrant | BADHDUFLAG | Total packets | Discarded packets |
| A | 0 | 682 | 0 |
| B | 0 | 682 | 0 |
| C | 0 | 682 | 0 |
| D | 0 | 682 | 0 |
| Mode M9 | |||
|---|---|---|---|
| Quadrant | BADHDUFLAG | Total packets | Discarded packets |
| A | 0 | 71 | 0 |
| B | 0 | 71 | 0 |
| C | 0 | 71 | 0 |
| D | 0 | 71 | 0 |
| Mode M0 | |||
|---|---|---|---|
| Quadrant | BADHDUFLAG | Total packets | Discarded packets |
| A | 0 | 70863 | 0 |
| B | 0 | 77881 | 0 |
| C | 0 | 89146 | 0 |
| D | 0 | 135357 | 0 |
| Quadrant | Total seconds | Saturated seconds | Saturation percentage |
|---|---|---|---|
| A | 33566 | 426 | 1.269141% |
| B | 33566 | 851 | 2.535304% |
| C | 33566 | 2458 | 7.322886% |
| D | 33566 | 5116 | 15.241614% |
Noise dominated data is calculated using 1-second bins in cleaned event files. If a bin has >2000 counts, and if more than 50% of those come from <1% of pixels, then it is considered to be noise-dominated and hence unusable.
| Quadrant | # 1 sec bins | Bins with >0 counts | Bins with >2000 counts | High rate bins dominated by noise | Noise dominated (total time) | Noise dominated (detector-on time) | Marked lightcurve |
|---|---|---|---|---|---|---|---|
| A | 40175 | 33566 | 0 | 0 | 0.00% | 0.00% |  |
| B | 40175 | 33565 | 21 | 21 | 0.05% | 0.06% |  |
| C | 40175 | 33560 | 0 | 0 | 0.00% | 0.00% |  |
| D | 40175 | 33564 | 1648 | 1648 | 4.10% | 4.91% |  |
Top three noisy pixels from each quadrant. If the there are fewer than three noisy pixels in the level2.evt file, extra rows are filled as -1
| Pixel properties | Quadrant properties | ||||||
|---|---|---|---|---|---|---|---|
| Quadrant | DetID | PixID | Counts | Sigma | Mean | Median | Sigma |
| A | 13 | 254 | 64478 | 146.84 | 1997 | 1969 | 425.7 |
| A | 0 | 226 | 12867 | 25.6 | 1997 | 1969 | 425.7 |
| A | 12 | 194 | 12286 | 24.24 | 1997 | 1969 | 425.7 |
| B | 0 | 229 | 887870 | 2401.47 | 1971 | 1933 | 368.9 |
| B | 0 | 183 | 309612 | 834.01 | 1971 | 1933 | 368.9 |
| B | 10 | 245 | 154612 | 413.86 | 1971 | 1933 | 368.9 |
| C | 3 | 233 | 4536319 | 10477.59 | 1830 | 1827 | 432.8 |
| C | 14 | 254 | 275665 | 632.74 | 1830 | 1827 | 432.8 |
| C | 2 | 114 | 64896 | 145.73 | 1830 | 1827 | 432.8 |
| D | 1 | 52 | 10857916 | 24550.27 | 1840 | 1796 | 442.2 |
| D | 8 | 195 | 4710923 | 10649.32 | 1840 | 1796 | 442.2 |
| D | 7 | 80 | 755815 | 1705.16 | 1840 | 1796 | 442.2 |
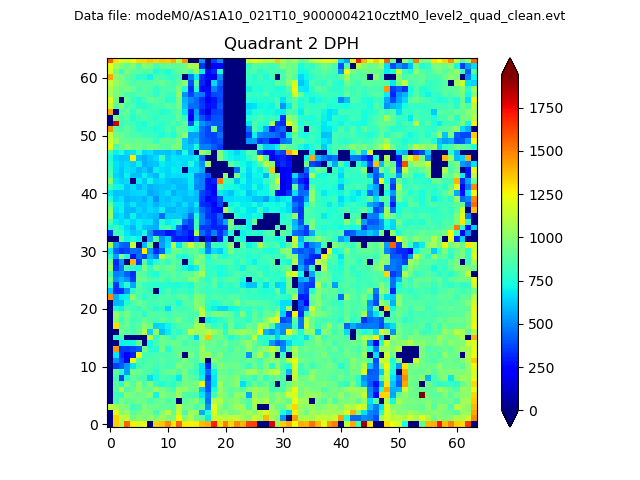
Histogram calculated using DETX and DETY for each event in the final _common_clean file
| Quadrant A |  |
 |
Quadrant B |
|---|---|---|---|
| Quadrant D |  |
 |
Quadrant C |
| Plot type | Count rate plots | Images |
|---|---|---|
| Comparison with Poisson distribution Blue bars denote a histogram of data divided into 1 sec bins. Red curve is a Poisson curve with rate = median count rate of data. |
 |
 |
| Quadrant-wise count rates Data is divided into 100 sec bins |
 |
|
| Module-wise count rates for Quadrant A Data is divided into 100 sec bins |
 |
 |
| Module-wise count rates for Quadrant B Data is divided into 100 sec bins |
 |
 |
| Module-wise count rates for Quadrant C Data is divided into 100 sec bins |
 |
 |
| Module-wise count rates for Quadrant D Data is divided into 100 sec bins |
 |
 |
| Parameter | Plot |
|---|---|
| CZT HV Monitor |  |
| D_VDD |  |
| Temperature 1 |  |
| Veto HV Monitor |  |
| Veto LLD |  |
| Alpha Counter |  |
| _CPM_Rate |  |
| CZT Counter | 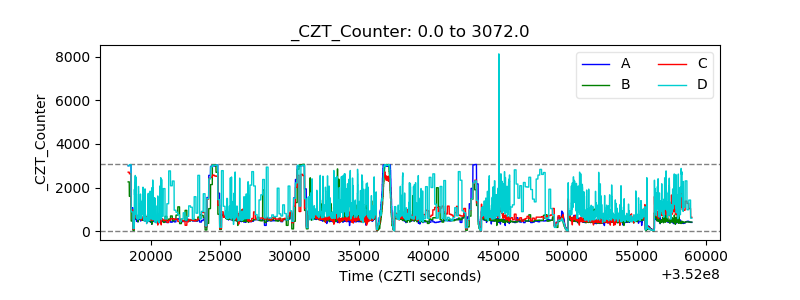 |
| +2.5 Volts monitor |  |
| +5 Volts monitor |  |
| _ROLL_ROT |  |
| _Roll_DEC |  |
| _Roll_RA |  |
| Veto Counter |  |