| Param | Original file | Final file |
|---|---|---|
| Filename | modeM0/AS1A10_045T08_9000004208cztM0_level2_bc.evt | modeM0/AS1A10_045T08_9000004208cztM0_level2_quad_clean.evt |
| Size (bytes) | 7,239,191,040 | 1,573,989,120 |
| Size | 6.7 GB | 1.5 GB |
| Events in quadrant A | 27,101,296 | 9,968,140 |
| Events in quadrant B | 35,907,036 | 10,084,695 |
| Events in quadrant C | 80,220,831 | 9,391,769 |
| Events in quadrant D | 67,447,550 | 9,579,245 |
| Mode SS | |||
|---|---|---|---|
| Quadrant | BADHDUFLAG | Total packets | Discarded packets |
| A | 0 | 2570 | 0 |
| B | 0 | 2570 | 0 |
| C | 0 | 2570 | 0 |
| D | 0 | 2570 | 0 |
| Mode M0 | |||
|---|---|---|---|
| Quadrant | BADHDUFLAG | Total packets | Discarded packets |
| A | 0 | 264271 | 0 |
| B | 0 | 299778 | 0 |
| C | 0 | 447221 | 0 |
| D | 0 | 399839 | 0 |
| Mode M9 | |||
|---|---|---|---|
| Quadrant | BADHDUFLAG | Total packets | Discarded packets |
| A | 0 | 183 | 0 |
| B | 0 | 183 | 0 |
| C | 0 | 183 | 0 |
| D | 0 | 183 | 0 |
| Quadrant | Total seconds | Saturated seconds | Saturation percentage |
|---|---|---|---|
| A | 126223 | 1380 | 1.093303% |
| B | 126223 | 3395 | 2.689684% |
| C | 126223 | 16333 | 12.939797% |
| D | 126223 | 7546 | 5.978308% |
Noise dominated data is calculated using 1-second bins in cleaned event files. If a bin has >2000 counts, and if more than 50% of those come from <1% of pixels, then it is considered to be noise-dominated and hence unusable.
| Quadrant | # 1 sec bins | Bins with >0 counts | Bins with >2000 counts | High rate bins dominated by noise | Noise dominated (total time) | Noise dominated (detector-on time) | Marked lightcurve |
|---|---|---|---|---|---|---|---|
| A | 144393 | 126225 | 41 | 41 | 0.03% | 0.03% |  |
| B | 144393 | 126225 | 120 | 120 | 0.08% | 0.10% |  |
| C | 144393 | 126212 | 1043 | 1043 | 0.72% | 0.83% |  |
| D | 144393 | 126225 | 1313 | 1313 | 0.91% | 1.04% | 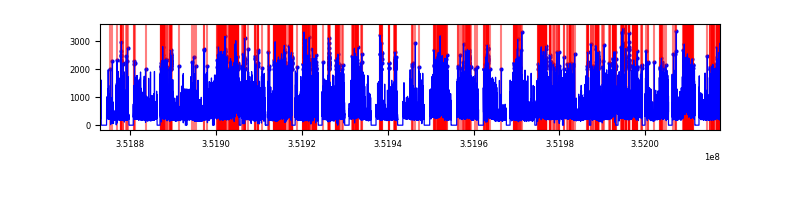 |
Top three noisy pixels from each quadrant. If the there are fewer than three noisy pixels in the level2.evt file, extra rows are filled as -1
| Pixel properties | Quadrant properties | ||||||
|---|---|---|---|---|---|---|---|
| Quadrant | DetID | PixID | Counts | Sigma | Mean | Median | Sigma |
| A | 15 | 174 | 283129 | 188.4 | 6878 | 6770 | 1466.9 |
| A | 13 | 254 | 232668 | 154.0 | 6878 | 6770 | 1466.9 |
| A | 1 | 113 | 132326 | 85.59 | 6878 | 6770 | 1466.9 |
| B | 0 | 229 | 2441099 | 1887.0 | 6877 | 6719 | 1290.1 |
| B | 10 | 245 | 2367602 | 1830.03 | 6877 | 6719 | 1290.1 |
| B | 10 | 247 | 2038893 | 1575.23 | 6877 | 6719 | 1290.1 |
| C | 3 | 233 | 54482544 | 36732.39 | 6372 | 6363 | 1483.1 |
| C | 14 | 254 | 522644 | 348.12 | 6372 | 6363 | 1483.1 |
| C | 7 | 247 | 284305 | 187.41 | 6372 | 6363 | 1483.1 |
| D | 1 | 52 | 17342594 | 10446.35 | 6662 | 6499 | 1659.5 |
| D | 8 | 195 | 13190102 | 7944.15 | 6662 | 6499 | 1659.5 |
| D | 7 | 80 | 4594110 | 2764.39 | 6662 | 6499 | 1659.5 |
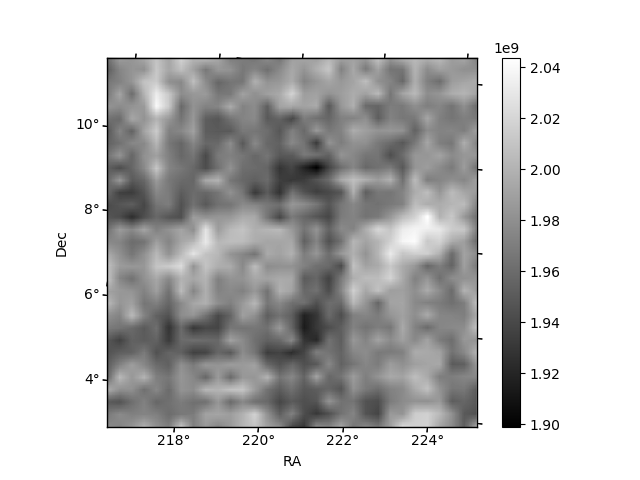
Histogram calculated using DETX and DETY for each event in the final _common_clean file
| Quadrant A | 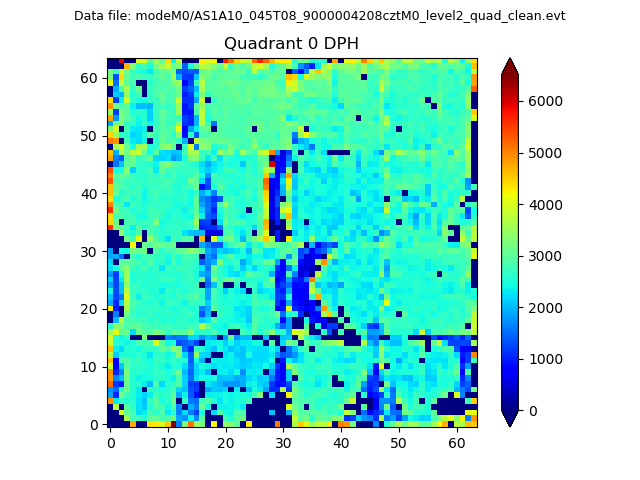 |
 |
Quadrant B |
|---|---|---|---|
| Quadrant D |  |
 |
Quadrant C |
| Plot type | Count rate plots | Images |
|---|---|---|
| Comparison with Poisson distribution Blue bars denote a histogram of data divided into 1 sec bins. Red curve is a Poisson curve with rate = median count rate of data. |
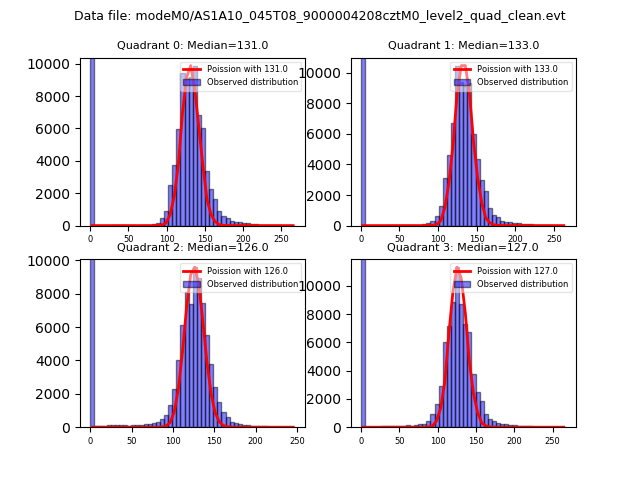 |
 |
| Quadrant-wise count rates Data is divided into 100 sec bins |
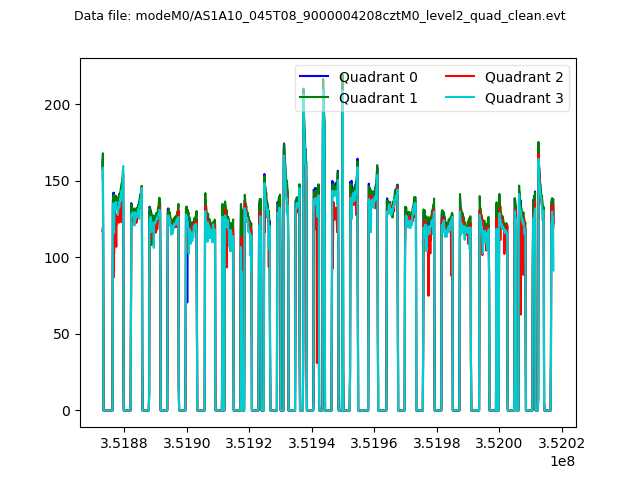 |
|
| Module-wise count rates for Quadrant A Data is divided into 100 sec bins |
 |
 |
| Module-wise count rates for Quadrant B Data is divided into 100 sec bins |
 |
 |
| Module-wise count rates for Quadrant C Data is divided into 100 sec bins |
 |
 |
| Module-wise count rates for Quadrant D Data is divided into 100 sec bins |
 |
 |
| Parameter | Plot |
|---|---|
| CZT HV Monitor |  |
| D_VDD |  |
| Temperature 1 | 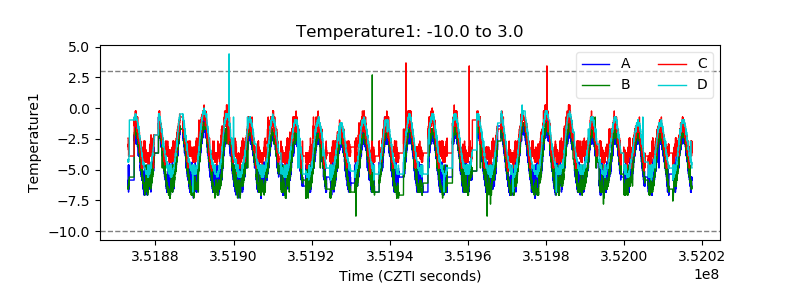 |
| Veto HV Monitor |  |
| Veto LLD |  |
| Alpha Counter | 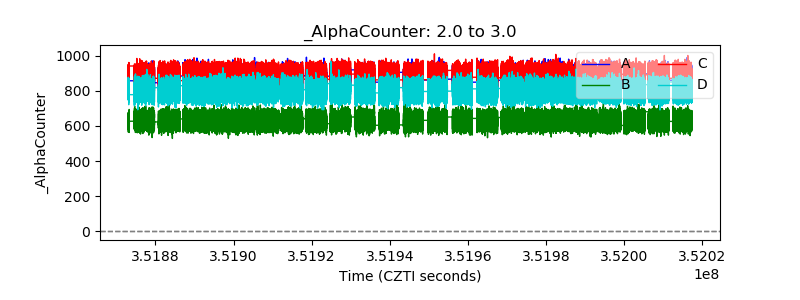 |
| _CPM_Rate | 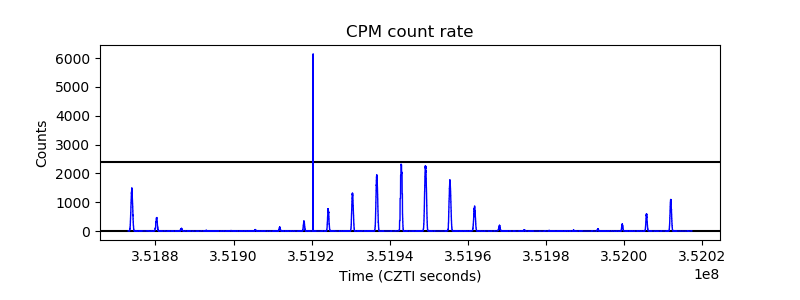 |
| CZT Counter |  |
| +2.5 Volts monitor |  |
| +5 Volts monitor |  |
| _ROLL_ROT | 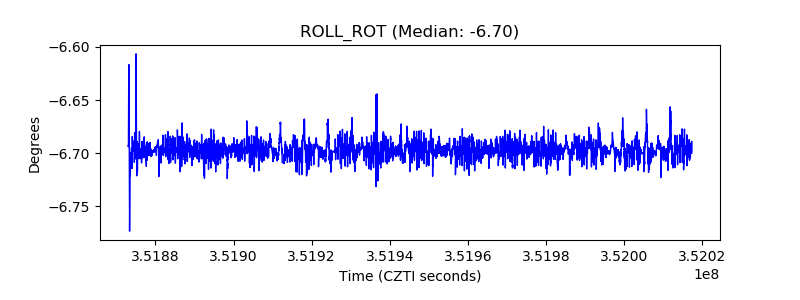 |
| _Roll_DEC |  |
| _Roll_RA |  |
| Veto Counter |  |