| Param | Original file | Final file |
|---|---|---|
| Filename | modeM0/AS1T03_272T01_9000004204cztM0_level2_bc.evt | modeM0/AS1T03_272T01_9000004204cztM0_level2_quad_clean.evt |
| Size (bytes) | 5,941,512,000 | 983,257,920 |
| Size | 5.5 GB | 937.7 MB |
| Events in quadrant A | 16,343,200 | 6,664,632 |
| Events in quadrant B | 22,411,177 | 6,691,665 |
| Events in quadrant C | 72,571,909 | 5,790,421 |
| Events in quadrant D | 63,550,485 | 5,507,647 |
| Mode M9 | |||
|---|---|---|---|
| Quadrant | BADHDUFLAG | Total packets | Discarded packets |
| A | 0 | 121 | 0 |
| B | 0 | 121 | 0 |
| C | 0 | 121 | 0 |
| D | 0 | 121 | 0 |
| Mode SS | |||
|---|---|---|---|
| Quadrant | BADHDUFLAG | Total packets | Discarded packets |
| A | 0 | 1520 | 0 |
| B | 0 | 1520 | 0 |
| C | 0 | 1520 | 0 |
| D | 0 | 1520 | 0 |
| Mode M0 | |||
|---|---|---|---|
| Quadrant | BADHDUFLAG | Total packets | Discarded packets |
| A | 0 | 155590 | 0 |
| B | 0 | 179500 | 0 |
| C | 0 | 340786 | 0 |
| D | 0 | 324655 | 0 |
| Quadrant | Total seconds | Saturated seconds | Saturation percentage |
|---|---|---|---|
| A | 74656 | 767 | 1.027379% |
| B | 74656 | 2093 | 2.803526% |
| C | 74656 | 21258 | 28.474604% |
| D | 74656 | 19525 | 26.153290% |
Noise dominated data is calculated using 1-second bins in cleaned event files. If a bin has >2000 counts, and if more than 50% of those come from <1% of pixels, then it is considered to be noise-dominated and hence unusable.
| Quadrant | # 1 sec bins | Bins with >0 counts | Bins with >2000 counts | High rate bins dominated by noise | Noise dominated (total time) | Noise dominated (detector-on time) | Marked lightcurve |
|---|---|---|---|---|---|---|---|
| A | 89267 | 74663 | 0 | 0 | 0.00% | 0.00% |  |
| B | 89268 | 74657 | 29 | 29 | 0.03% | 0.04% |  |
| C | 89267 | 74657 | 3417 | 3417 | 3.83% | 4.58% |  |
| D | 89267 | 74614 | 7616 | 7616 | 8.53% | 10.21% |  |
Top three noisy pixels from each quadrant. If the there are fewer than three noisy pixels in the level2.evt file, extra rows are filled as -1
| Pixel properties | Quadrant properties | ||||||
|---|---|---|---|---|---|---|---|
| Quadrant | DetID | PixID | Counts | Sigma | Mean | Median | Sigma |
| A | 13 | 254 | 140501 | 153.93 | 4185 | 4127 | 885.9 |
| A | 0 | 13 | 125463 | 136.96 | 4185 | 4127 | 885.9 |
| A | 0 | 226 | 26763 | 25.55 | 4185 | 4127 | 885.9 |
| B | 10 | 245 | 2644695 | 3405.28 | 4166 | 4082 | 775.4 |
| B | 0 | 229 | 1797467 | 2312.72 | 4166 | 4082 | 775.4 |
| B | 0 | 183 | 929993 | 1194.04 | 4166 | 4082 | 775.4 |
| C | 3 | 233 | 58243033 | 67153.45 | 3641 | 3637 | 867.3 |
| C | 2 | 114 | 135700 | 152.28 | 3641 | 3637 | 867.3 |
| C | 14 | 254 | 129006 | 144.56 | 3641 | 3637 | 867.3 |
| D | 7 | 223 | 27096192 | 32607.77 | 3606 | 3498 | 830.9 |
| D | 1 | 52 | 15590229 | 18759.61 | 3606 | 3498 | 830.9 |
| D | 8 | 195 | 3371686 | 4053.83 | 3606 | 3498 | 830.9 |
Histogram calculated using DETX and DETY for each event in the final _common_clean file
| Quadrant A |  |
 |
Quadrant B |
|---|---|---|---|
| Quadrant D |  |
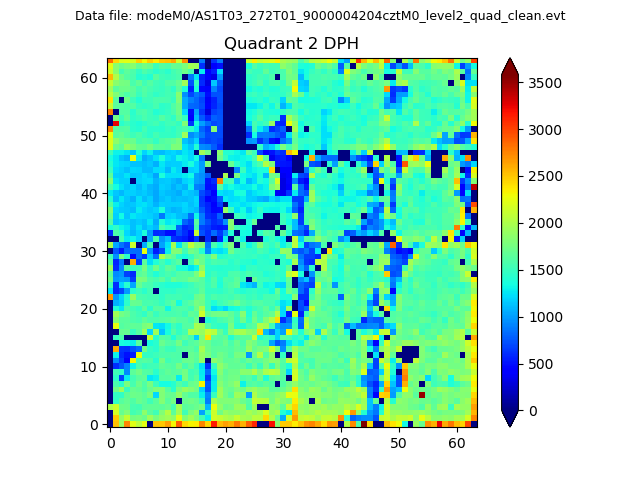 |
Quadrant C |
| Plot type | Count rate plots | Images |
|---|---|---|
| Comparison with Poisson distribution Blue bars denote a histogram of data divided into 1 sec bins. Red curve is a Poisson curve with rate = median count rate of data. |
 |
 |
| Quadrant-wise count rates Data is divided into 100 sec bins |
 |
|
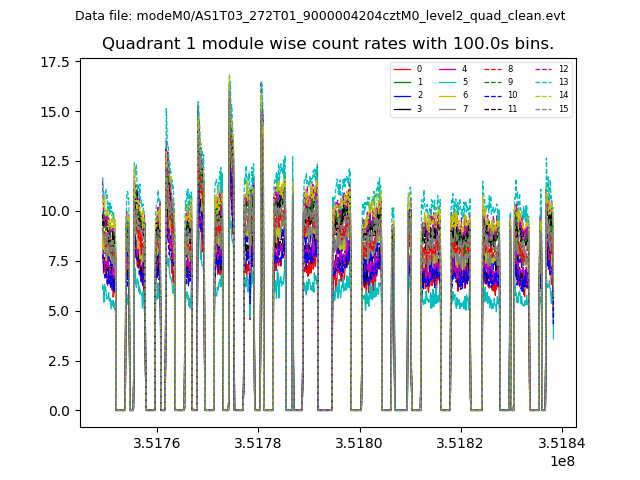
| Module-wise count rates for Quadrant A Data is divided into 100 sec bins |
 |
 |
| Module-wise count rates for Quadrant B Data is divided into 100 sec bins |
 |
 |
| Module-wise count rates for Quadrant C Data is divided into 100 sec bins |
 |
 |
| Module-wise count rates for Quadrant D Data is divided into 100 sec bins |
 |
 |
| Parameter | Plot |
|---|---|
| CZT HV Monitor |  |
| D_VDD |  |
| Temperature 1 |  |
| Veto HV Monitor |  |
| Veto LLD |  |
| Alpha Counter |  |
| _CPM_Rate |  |
| CZT Counter |  |
| +2.5 Volts monitor |  |
| +5 Volts monitor |  |
| _ROLL_ROT |  |
| _Roll_DEC |  |
| _Roll_RA |  |
| Veto Counter |  |