| Param | Original file | Final file |
|---|---|---|
| Filename | modeM0/AS1A10_102T02_9000004200cztM0_level2_bc.evt | modeM0/AS1A10_102T02_9000004200cztM0_level2_quad_clean.evt |
| Size (bytes) | 4,270,423,680 | 1,398,409,920 |
| Size | 4.0 GB | 1.3 GB |
| Events in quadrant A | 19,990,402 | 9,297,412 |
| Events in quadrant B | 25,121,066 | 9,361,184 |
| Events in quadrant C | 33,675,944 | 8,996,410 |
| Events in quadrant D | 44,472,288 | 8,582,764 |
| Mode SS | |||
|---|---|---|---|
| Quadrant | BADHDUFLAG | Total packets | Discarded packets |
| A | 0 | 1824 | 0 |
| B | 0 | 1824 | 0 |
| C | 0 | 1824 | 0 |
| D | 0 | 1824 | 0 |
| Mode M0 | |||
|---|---|---|---|
| Quadrant | BADHDUFLAG | Total packets | Discarded packets |
| A | 0 | 187870 | 0 |
| B | 0 | 207958 | 0 |
| C | 0 | 235533 | 0 |
| D | 0 | 282135 | 0 |
| Mode M9 | |||
|---|---|---|---|
| Quadrant | BADHDUFLAG | Total packets | Discarded packets |
| A | 0 | 155 | 0 |
| B | 0 | 155 | 0 |
| C | 0 | 155 | 0 |
| D | 0 | 155 | 0 |
| Quadrant | Total seconds | Saturated seconds | Saturation percentage |
|---|---|---|---|
| A | 89262 | 1101 | 1.233448% |
| B | 89262 | 2257 | 2.528512% |
| C | 89262 | 4292 | 4.808317% |
| D | 89262 | 7900 | 8.850351% |
Noise dominated data is calculated using 1-second bins in cleaned event files. If a bin has >2000 counts, and if more than 50% of those come from <1% of pixels, then it is considered to be noise-dominated and hence unusable.
| Quadrant | # 1 sec bins | Bins with >0 counts | Bins with >2000 counts | High rate bins dominated by noise | Noise dominated (total time) | Noise dominated (detector-on time) | Marked lightcurve |
|---|---|---|---|---|---|---|---|
| A | 104932 | 89266 | 54 | 54 | 0.05% | 0.06% |  |
| B | 104932 | 89265 | 43 | 43 | 0.04% | 0.05% |  |
| C | 104932 | 89266 | 125 | 125 | 0.12% | 0.14% | 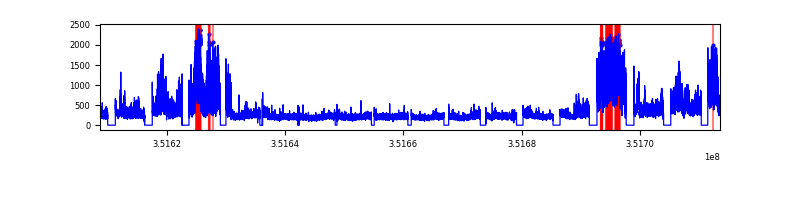 |
| D | 104932 | 89261 | 744 | 744 | 0.71% | 0.83% |  |
Top three noisy pixels from each quadrant. If the there are fewer than three noisy pixels in the level2.evt file, extra rows are filled as -1
| Pixel properties | Quadrant properties | ||||||
|---|---|---|---|---|---|---|---|
| Quadrant | DetID | PixID | Counts | Sigma | Mean | Median | Sigma |
| A | 0 | 13 | 357193 | 330.67 | 4994 | 4931 | 1065.3 |
| A | 15 | 174 | 251615 | 231.56 | 4994 | 4931 | 1065.3 |
| A | 13 | 254 | 171020 | 155.91 | 4994 | 4931 | 1065.3 |
| B | 10 | 245 | 2652932 | 2835.14 | 4975 | 4877 | 934.0 |
| B | 0 | 229 | 1714821 | 1830.75 | 4975 | 4877 | 934.0 |
| B | 0 | 183 | 682910 | 725.94 | 4975 | 4877 | 934.0 |
| C | 3 | 233 | 15100917 | 13445.75 | 4763 | 4758 | 1122.7 |
| C | 2 | 114 | 174788 | 151.44 | 4763 | 4758 | 1122.7 |
| C | 10 | 9 | 87606 | 73.79 | 4763 | 4758 | 1122.7 |
| D | 1 | 52 | 16838395 | 15493.62 | 4734 | 4598 | 1086.5 |
| D | 8 | 195 | 5970465 | 5490.91 | 4734 | 4598 | 1086.5 |
| D | 13 | 104 | 997705 | 914.04 | 4734 | 4598 | 1086.5 |
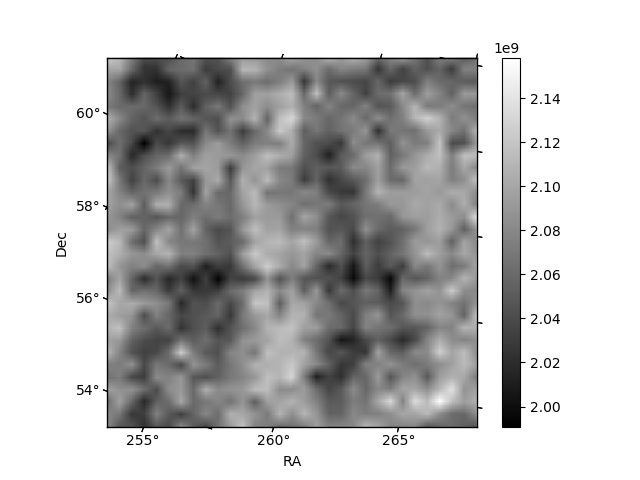
Histogram calculated using DETX and DETY for each event in the final _common_clean file
| Quadrant A | 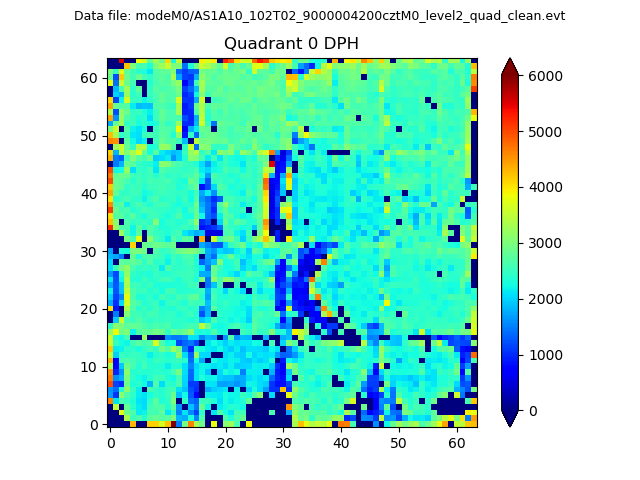 |
 |
Quadrant B |
|---|---|---|---|
| Quadrant D | 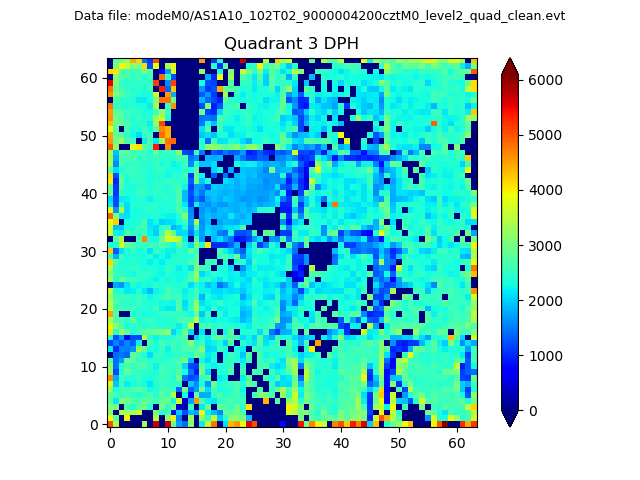 |
 |
Quadrant C |
| Plot type | Count rate plots | Images |
|---|---|---|
| Comparison with Poisson distribution Blue bars denote a histogram of data divided into 1 sec bins. Red curve is a Poisson curve with rate = median count rate of data. |
 |
 |
| Quadrant-wise count rates Data is divided into 100 sec bins |
 |
|
| Module-wise count rates for Quadrant A Data is divided into 100 sec bins |
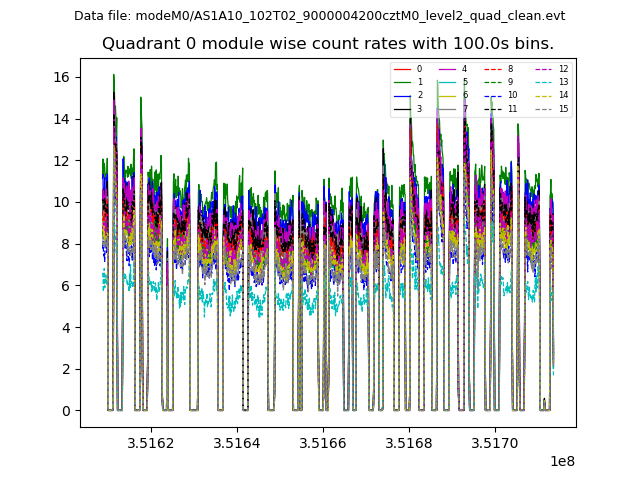 |
 |
| Module-wise count rates for Quadrant B Data is divided into 100 sec bins |
 |
 |
| Module-wise count rates for Quadrant C Data is divided into 100 sec bins |
 |
 |
| Module-wise count rates for Quadrant D Data is divided into 100 sec bins |
 |
 |
| Parameter | Plot |
|---|---|
| CZT HV Monitor | 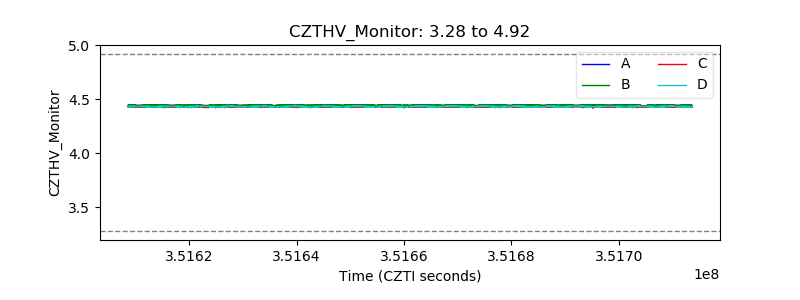 |
| D_VDD |  |
| Temperature 1 | 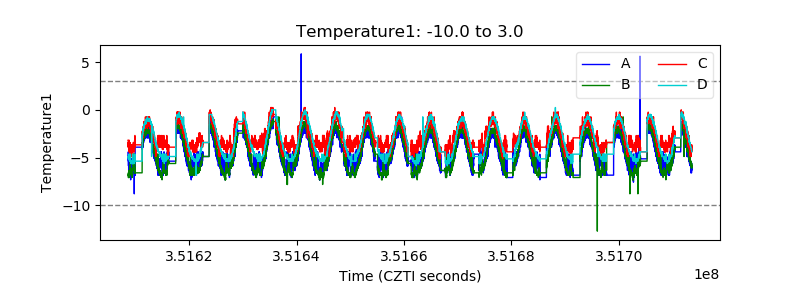 |
| Veto HV Monitor | 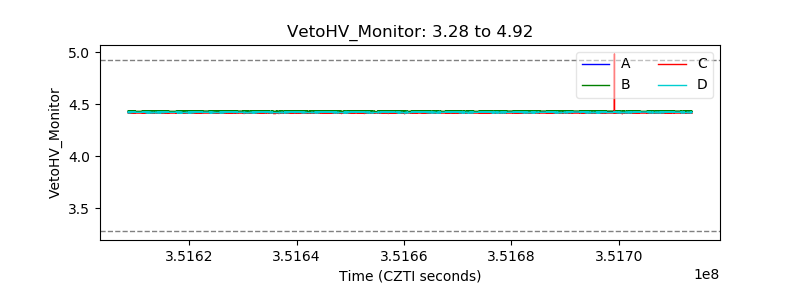 |
| Veto LLD |  |
| Alpha Counter |  |
| _CPM_Rate |  |
| CZT Counter |  |
| +2.5 Volts monitor |  |
| +5 Volts monitor |  |
| _ROLL_ROT | 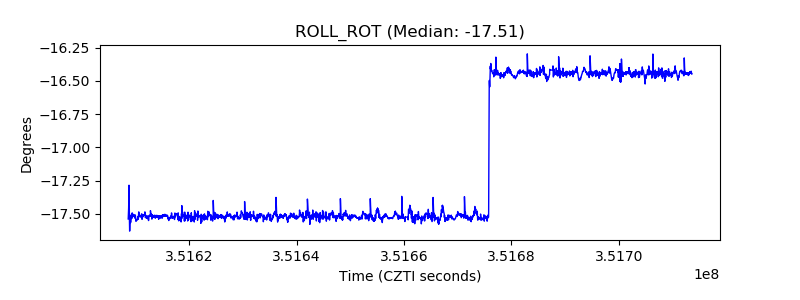 |
| _Roll_DEC |  |
| _Roll_RA |  |
| Veto Counter |  |