| Param | Original file | Final file |
|---|---|---|
| Filename | modeM0/AS1A10_094T71_9000004196cztM0_level2_bc.evt | modeM0/AS1A10_094T71_9000004196cztM0_level2_quad_clean.evt |
| Size (bytes) | 358,862,400 | 105,367,680 |
| Size | 342.2 MB | 100.5 MB |
| Events in quadrant A | 1,167,261 | 742,349 |
| Events in quadrant B | 1,391,300 | 749,786 |
| Events in quadrant C | 5,128,656 | 657,653 |
| Events in quadrant D | 2,821,697 | 677,250 |
| Mode SS | |||
|---|---|---|---|
| Quadrant | BADHDUFLAG | Total packets | Discarded packets |
| A | 0 | 106 | 0 |
| B | 0 | 106 | 0 |
| C | 0 | 106 | 0 |
| D | 0 | 106 | 0 |
| Mode M9 | |||
|---|---|---|---|
| Quadrant | BADHDUFLAG | Total packets | Discarded packets |
| A | 0 | 10 | 0 |
| B | 0 | 10 | 0 |
| C | 0 | 10 | 0 |
| D | 0 | 10 | 0 |
| Mode M0 | |||
|---|---|---|---|
| Quadrant | BADHDUFLAG | Total packets | Discarded packets |
| A | 0 | 10916 | 0 |
| B | 0 | 11806 | 0 |
| C | 0 | 23781 | 0 |
| D | 0 | 16688 | 0 |
| Quadrant | Total seconds | Saturated seconds | Saturation percentage |
|---|---|---|---|
| A | 5191 | 34 | 0.654980% |
| B | 5191 | 72 | 1.387016% |
| C | 5191 | 934 | 17.992680% |
| D | 5191 | 313 | 6.029667% |
Noise dominated data is calculated using 1-second bins in cleaned event files. If a bin has >2000 counts, and if more than 50% of those come from <1% of pixels, then it is considered to be noise-dominated and hence unusable.
| Quadrant | # 1 sec bins | Bins with >0 counts | Bins with >2000 counts | High rate bins dominated by noise | Noise dominated (total time) | Noise dominated (detector-on time) | Marked lightcurve |
|---|---|---|---|---|---|---|---|
| A | 6231 | 5191 | 0 | 0 | 0.00% | 0.00% | 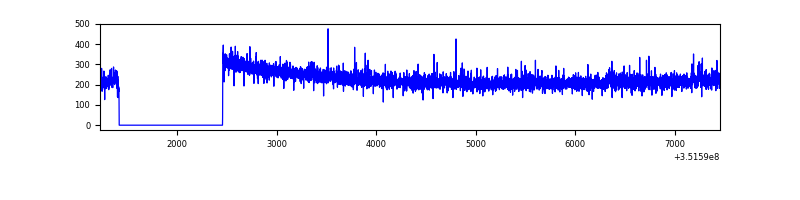 |
| B | 6231 | 5191 | 3 | 3 | 0.05% | 0.06% |  |
| C | 6231 | 5192 | 77 | 77 | 1.24% | 1.48% | 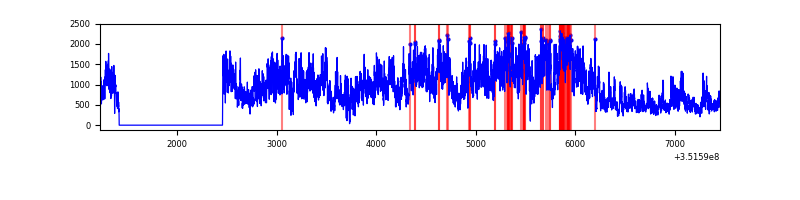 |
| D | 6231 | 5191 | 40 | 40 | 0.64% | 0.77% |  |
Top three noisy pixels from each quadrant. If the there are fewer than three noisy pixels in the level2.evt file, extra rows are filled as -1
| Pixel properties | Quadrant properties | ||||||
|---|---|---|---|---|---|---|---|
| Quadrant | DetID | PixID | Counts | Sigma | Mean | Median | Sigma |
| A | 0 | 13 | 13255 | 197.82 | 298 | 293 | 65.5 |
| A | 13 | 254 | 10014 | 148.36 | 298 | 293 | 65.5 |
| A | 0 | 226 | 1869 | 24.05 | 298 | 293 | 65.5 |
| B | 0 | 229 | 128671 | 2199.04 | 298 | 293 | 58.4 |
| B | 0 | 183 | 57402 | 978.24 | 298 | 293 | 58.4 |
| B | 10 | 245 | 35398 | 601.33 | 298 | 293 | 58.4 |
| C | 3 | 233 | 4068991 | 61670.05 | 269 | 267 | 66.0 |
| C | 14 | 254 | 17018 | 253.9 | 269 | 267 | 66.0 |
| C | 2 | 114 | 9759 | 143.87 | 269 | 267 | 66.0 |
| D | 1 | 52 | 913243 | 13537.62 | 284 | 274 | 67.4 |
| D | 8 | 195 | 749615 | 11111.32 | 284 | 274 | 67.4 |
| D | 2 | 250 | 39032 | 574.71 | 284 | 274 | 67.4 |
Histogram calculated using DETX and DETY for each event in the final _common_clean file
| Quadrant A |  |
 |
Quadrant B |
|---|---|---|---|
| Quadrant D | 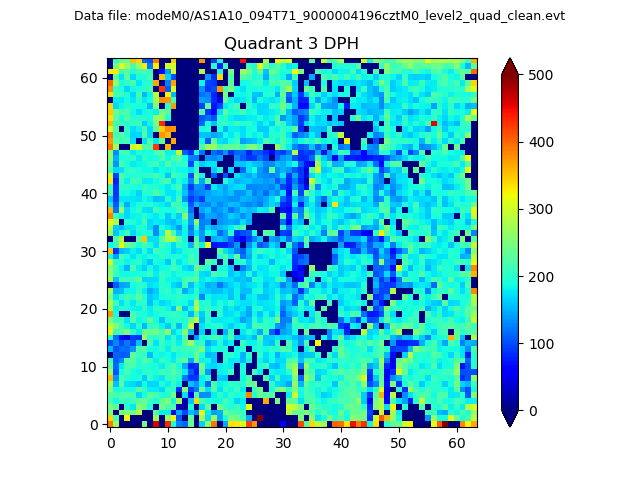 |
 |
Quadrant C |
| Plot type | Count rate plots | Images |
|---|---|---|
| Comparison with Poisson distribution Blue bars denote a histogram of data divided into 1 sec bins. Red curve is a Poisson curve with rate = median count rate of data. |
 |
 |
| Quadrant-wise count rates Data is divided into 100 sec bins |
 |
|
| Module-wise count rates for Quadrant A Data is divided into 100 sec bins |
 |
 |
| Module-wise count rates for Quadrant B Data is divided into 100 sec bins |
 |
 |
| Module-wise count rates for Quadrant C Data is divided into 100 sec bins |
 |
 |
| Module-wise count rates for Quadrant D Data is divided into 100 sec bins |
 |
 |
| Parameter | Plot |
|---|---|
| CZT HV Monitor |  |
| D_VDD |  |
| Temperature 1 |  |
| Veto HV Monitor |  |
| Veto LLD | 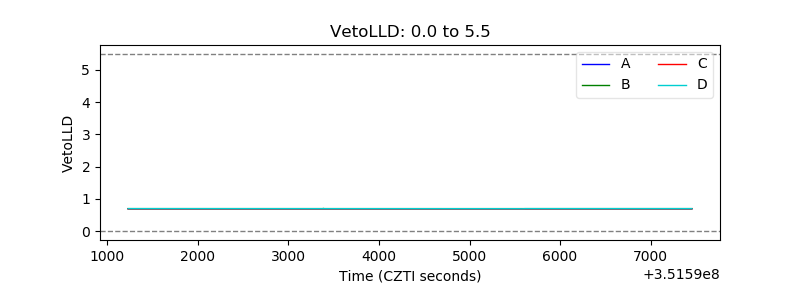 |
| Alpha Counter | 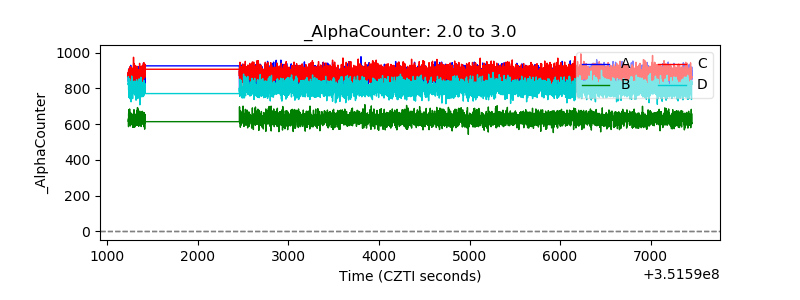 |
| _CPM_Rate |  |
| CZT Counter | 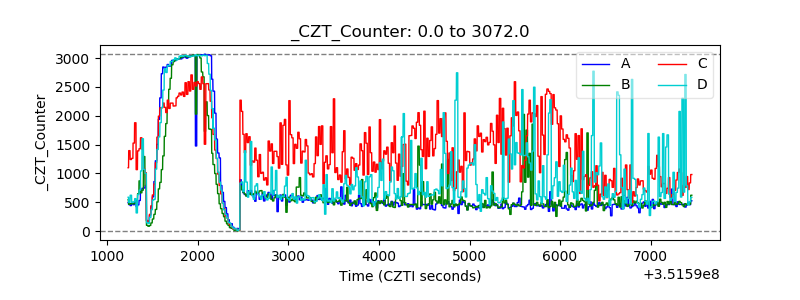 |
| +2.5 Volts monitor |  |
| +5 Volts monitor |  |
| _ROLL_ROT | 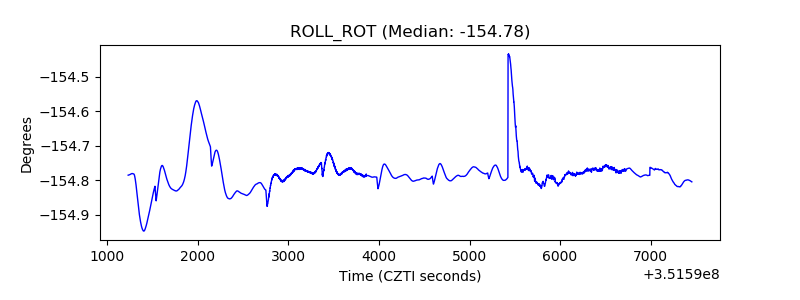 |
| _Roll_DEC |  |
| _Roll_RA |  |
| Veto Counter |  |