| Param | Original file | Final file |
|---|---|---|
| Filename | modeM0/AS1A10_053T43_9000004198cztM0_level2_bc.evt | modeM0/AS1A10_053T43_9000004198cztM0_level2_quad_clean.evt |
| Size (bytes) | 546,753,600 | 95,532,480 |
| Size | 521.4 MB | 91.1 MB |
| Events in quadrant A | 2,019,417 | 616,188 |
| Events in quadrant B | 2,578,612 | 614,842 |
| Events in quadrant C | 4,773,387 | 568,654 |
| Events in quadrant D | 6,642,213 | 541,130 |
| Mode M9 | |||
|---|---|---|---|
| Quadrant | BADHDUFLAG | Total packets | Discarded packets |
| A | 0 | 12 | 0 |
| B | 0 | 12 | 0 |
| C | 0 | 12 | 0 |
| D | 0 | 12 | 0 |
| Mode SS | |||
|---|---|---|---|
| Quadrant | BADHDUFLAG | Total packets | Discarded packets |
| A | 0 | 162 | 0 |
| B | 0 | 162 | 0 |
| C | 0 | 162 | 0 |
| D | 0 | 162 | 0 |
| Mode M0 | |||
|---|---|---|---|
| Quadrant | BADHDUFLAG | Total packets | Discarded packets |
| A | 0 | 17646 | 0 |
| B | 0 | 20073 | 0 |
| C | 0 | 27395 | 0 |
| D | 0 | 33529 | 0 |
| Quadrant | Total seconds | Saturated seconds | Saturation percentage |
|---|---|---|---|
| A | 7934 | 91 | 1.146962% |
| B | 7934 | 194 | 2.445173% |
| C | 7934 | 459 | 5.785228% |
| D | 7934 | 1139 | 14.355936% |
Noise dominated data is calculated using 1-second bins in cleaned event files. If a bin has >2000 counts, and if more than 50% of those come from <1% of pixels, then it is considered to be noise-dominated and hence unusable.
| Quadrant | # 1 sec bins | Bins with >0 counts | Bins with >2000 counts | High rate bins dominated by noise | Noise dominated (total time) | Noise dominated (detector-on time) | Marked lightcurve |
|---|---|---|---|---|---|---|---|
| A | 9159 | 7935 | 0 | 0 | 0.00% | 0.00% | 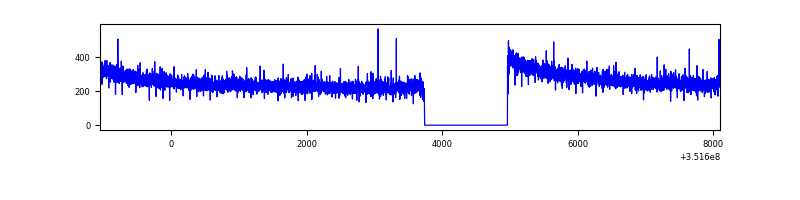 |
| B | 9159 | 7934 | 1 | 1 | 0.01% | 0.01% |  |
| C | 9159 | 7934 | 5 | 5 | 0.05% | 0.06% |  |
| D | 9159 | 7935 | 314 | 314 | 3.43% | 3.96% |  |
Top three noisy pixels from each quadrant. If the there are fewer than three noisy pixels in the level2.evt file, extra rows are filled as -1
| Pixel properties | Quadrant properties | ||||||
|---|---|---|---|---|---|---|---|
| Quadrant | DetID | PixID | Counts | Sigma | Mean | Median | Sigma |
| A | 0 | 13 | 22914 | 202.67 | 517 | 510 | 110.5 |
| A | 13 | 254 | 15615 | 136.64 | 517 | 510 | 110.5 |
| A | 0 | 226 | 3289 | 25.14 | 517 | 510 | 110.5 |
| B | 10 | 245 | 191823 | 1997.06 | 514 | 506 | 95.8 |
| B | 0 | 183 | 178592 | 1858.95 | 514 | 506 | 95.8 |
| B | 0 | 229 | 111835 | 1162.1 | 514 | 506 | 95.8 |
| C | 3 | 233 | 2917011 | 26181.33 | 478 | 478 | 111.4 |
| C | 2 | 114 | 15133 | 131.56 | 478 | 478 | 111.4 |
| C | 10 | 22 | 4689 | 37.8 | 478 | 478 | 111.4 |
| D | 1 | 52 | 2063416 | 19242.39 | 472 | 460 | 107.2 |
| D | 8 | 195 | 1859383 | 17339.25 | 472 | 460 | 107.2 |
| D | 7 | 80 | 755894 | 7046.37 | 472 | 460 | 107.2 |
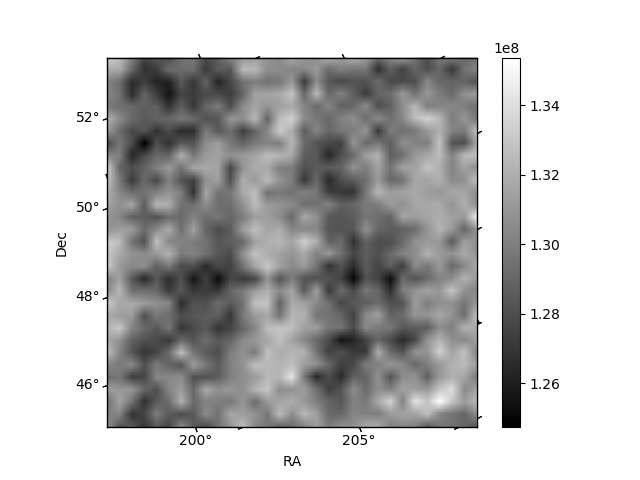
Histogram calculated using DETX and DETY for each event in the final _common_clean file
| Quadrant A | 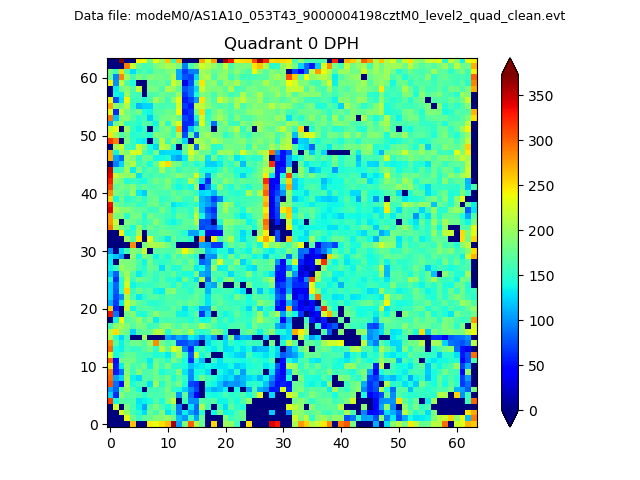 |
 |
Quadrant B |
|---|---|---|---|
| Quadrant D |  |
 |
Quadrant C |
| Plot type | Count rate plots | Images |
|---|---|---|
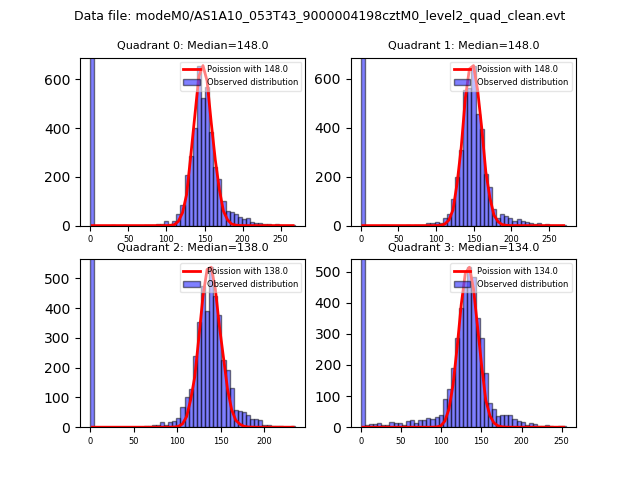
| Comparison with Poisson distribution Blue bars denote a histogram of data divided into 1 sec bins. Red curve is a Poisson curve with rate = median count rate of data. |
 |
 |
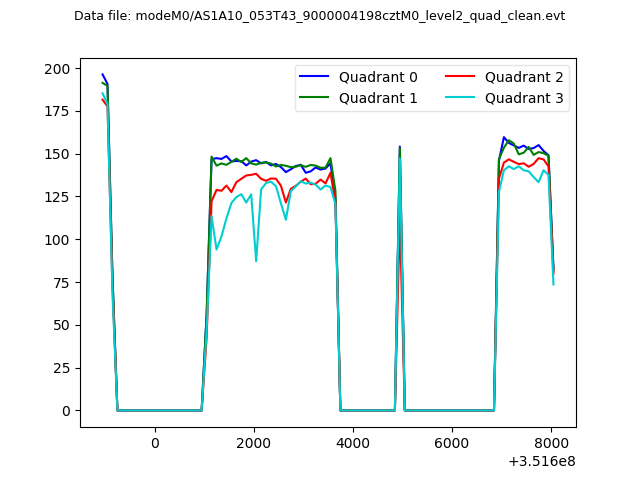
| Quadrant-wise count rates Data is divided into 100 sec bins |
 |
|
| Module-wise count rates for Quadrant A Data is divided into 100 sec bins |
 |
 |
| Module-wise count rates for Quadrant B Data is divided into 100 sec bins |
 |
 |
| Module-wise count rates for Quadrant C Data is divided into 100 sec bins |
 |
 |
| Module-wise count rates for Quadrant D Data is divided into 100 sec bins |
 |
 |
| Parameter | Plot |
|---|---|
| CZT HV Monitor |  |
| D_VDD | 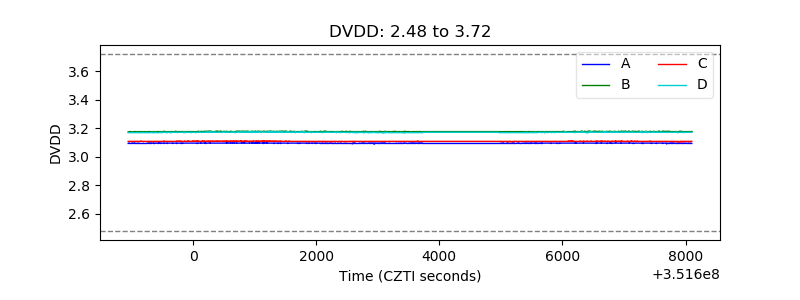 |
| Temperature 1 |  |
| Veto HV Monitor |  |
| Veto LLD | 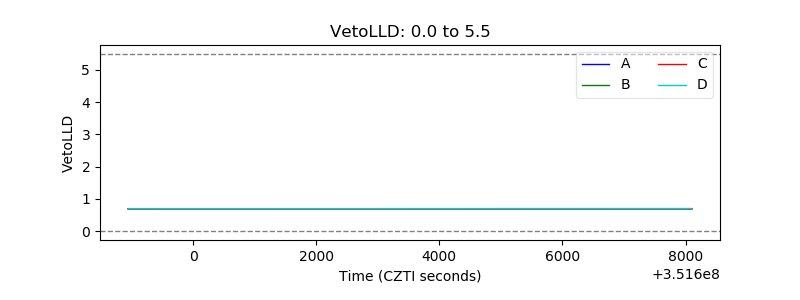 |
| Alpha Counter |  |
| _CPM_Rate |  |
| CZT Counter |  |
| +2.5 Volts monitor |  |
| +5 Volts monitor | 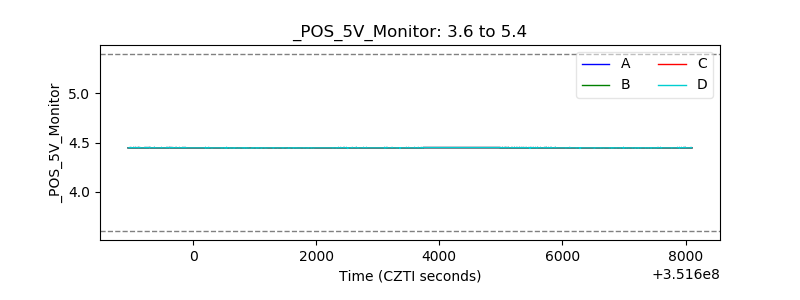 |
| _ROLL_ROT | 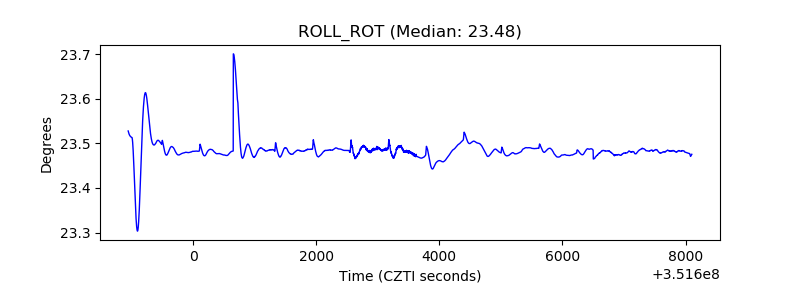 |
| _Roll_DEC |  |
| _Roll_RA |  |
| Veto Counter | 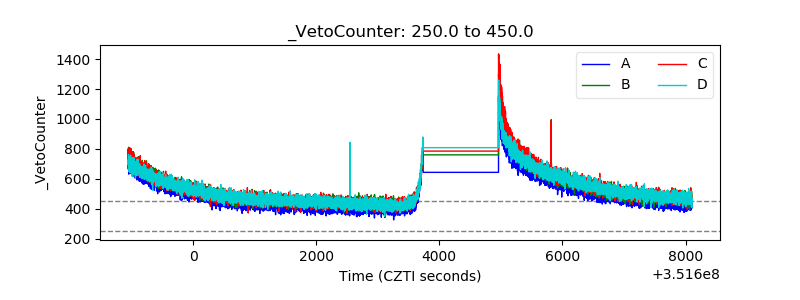 |