| Param | Original file | Final file |
|---|---|---|
| Filename | modeM0/AS1A10_053T41_9000004194cztM0_level2_bc.evt | modeM0/AS1A10_053T41_9000004194cztM0_level2_quad_clean.evt |
| Size (bytes) | 685,684,800 | 104,247,360 |
| Size | 653.9 MB | 99.4 MB |
| Events in quadrant A | 1,934,988 | 667,986 |
| Events in quadrant B | 2,410,649 | 673,377 |
| Events in quadrant C | 11,694,393 | 551,449 |
| Events in quadrant D | 4,081,182 | 611,167 |
| Mode M9 | |||
|---|---|---|---|
| Quadrant | BADHDUFLAG | Total packets | Discarded packets |
| A | 0 | 16 | 0 |
| B | 0 | 16 | 0 |
| C | 0 | 16 | 0 |
| D | 0 | 16 | 0 |
| Mode SS | |||
|---|---|---|---|
| Quadrant | BADHDUFLAG | Total packets | Discarded packets |
| A | 0 | 192 | 0 |
| B | 0 | 192 | 0 |
| C | 0 | 192 | 0 |
| D | 0 | 192 | 0 |
| Mode M0 | |||
|---|---|---|---|
| Quadrant | BADHDUFLAG | Total packets | Discarded packets |
| A | 0 | 19144 | 0 |
| B | 0 | 21133 | 0 |
| C | 0 | 50827 | 0 |
| D | 0 | 26747 | 0 |
| Quadrant | Total seconds | Saturated seconds | Saturation percentage |
|---|---|---|---|
| A | 9399 | 48 | 0.510693% |
| B | 9399 | 170 | 1.808703% |
| C | 9399 | 3507 | 37.312480% |
| D | 9399 | 345 | 3.670603% |
Noise dominated data is calculated using 1-second bins in cleaned event files. If a bin has >2000 counts, and if more than 50% of those come from <1% of pixels, then it is considered to be noise-dominated and hence unusable.
| Quadrant | # 1 sec bins | Bins with >0 counts | Bins with >2000 counts | High rate bins dominated by noise | Noise dominated (total time) | Noise dominated (detector-on time) | Marked lightcurve |
|---|---|---|---|---|---|---|---|
| A | 10293 | 9398 | 0 | 0 | 0.00% | 0.00% |  |
| B | 10293 | 9398 | 4 | 4 | 0.04% | 0.04% |  |
| C | 10293 | 9399 | 503 | 503 | 4.89% | 5.35% |  |
| D | 10293 | 9398 | 22 | 22 | 0.21% | 0.23% |  |
Top three noisy pixels from each quadrant. If the there are fewer than three noisy pixels in the level2.evt file, extra rows are filled as -1
| Pixel properties | Quadrant properties | ||||||
|---|---|---|---|---|---|---|---|
| Quadrant | DetID | PixID | Counts | Sigma | Mean | Median | Sigma |
| A | 0 | 13 | 32914 | 303.16 | 490 | 481 | 107.0 |
| A | 13 | 254 | 17225 | 156.51 | 490 | 481 | 107.0 |
| A | 12 | 194 | 3282 | 26.18 | 490 | 481 | 107.0 |
| B | 10 | 246 | 139404 | 1466.33 | 496 | 484 | 94.7 |
| B | 10 | 245 | 124420 | 1308.17 | 496 | 484 | 94.7 |
| B | 0 | 229 | 111594 | 1172.79 | 496 | 484 | 94.7 |
| C | 3 | 233 | 10018054 | 98544.1 | 424 | 420 | 101.7 |
| C | 9 | 54 | 26379 | 255.36 | 424 | 420 | 101.7 |
| C | 2 | 114 | 17164 | 164.71 | 424 | 420 | 101.7 |
| D | 1 | 52 | 1057510 | 9691.36 | 473 | 456 | 109.1 |
| D | 8 | 195 | 964801 | 8841.38 | 473 | 456 | 109.1 |
| D | 7 | 80 | 53006 | 481.79 | 473 | 456 | 109.1 |
Histogram calculated using DETX and DETY for each event in the final _common_clean file
| Quadrant A |  |
 |
Quadrant B |
|---|---|---|---|
| Quadrant D | 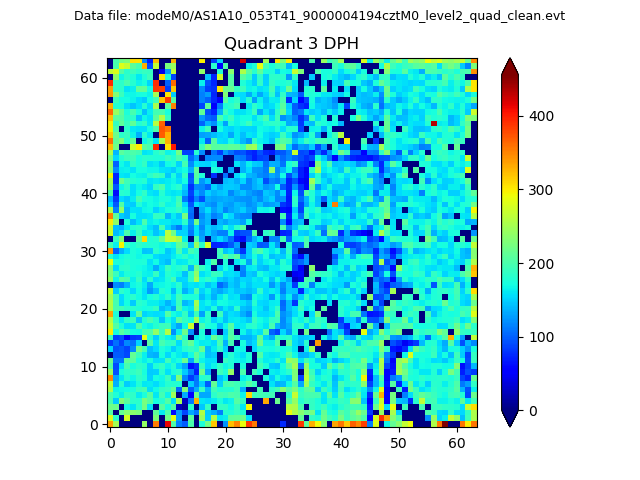 |
 |
Quadrant C |
| Plot type | Count rate plots | Images |
|---|---|---|
| Comparison with Poisson distribution Blue bars denote a histogram of data divided into 1 sec bins. Red curve is a Poisson curve with rate = median count rate of data. |
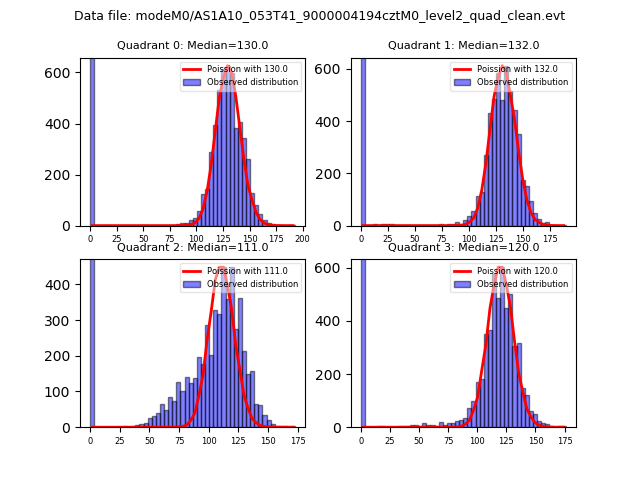 |
 |
| Quadrant-wise count rates Data is divided into 100 sec bins |
 |
|
| Module-wise count rates for Quadrant A Data is divided into 100 sec bins |
 |
 |
| Module-wise count rates for Quadrant B Data is divided into 100 sec bins |
 |
 |
| Module-wise count rates for Quadrant C Data is divided into 100 sec bins |
 |
 |
| Module-wise count rates for Quadrant D Data is divided into 100 sec bins |
 |
 |
| Parameter | Plot |
|---|---|
| CZT HV Monitor |  |
| D_VDD | 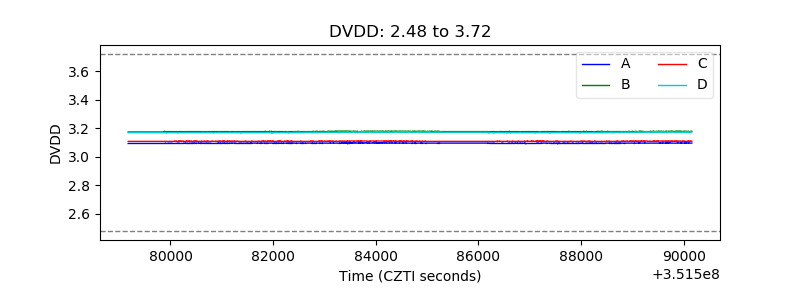 |
| Temperature 1 |  |
| Veto HV Monitor | 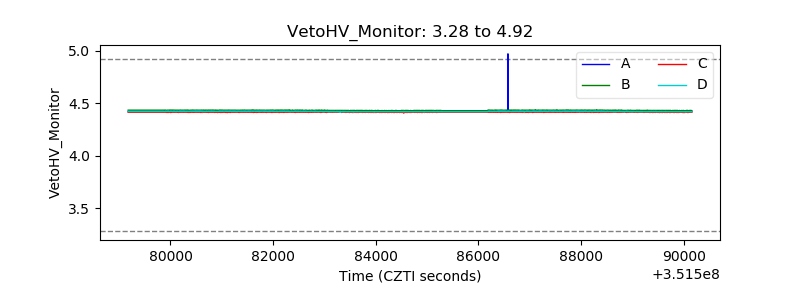 |
| Veto LLD | 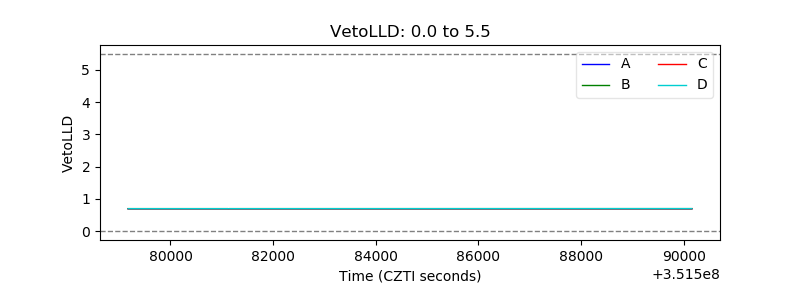 |
| Alpha Counter |  |
| _CPM_Rate |  |
| CZT Counter |  |
| +2.5 Volts monitor |  |
| +5 Volts monitor |  |
| _ROLL_ROT |  |
| _Roll_DEC |  |
| _Roll_RA |  |
| Veto Counter |  |