| Param | Original file | Final file |
|---|---|---|
| Filename | modeM0/AS1A10_053T34_9000004192cztM0_level2_bc.evt | modeM0/AS1A10_053T34_9000004192cztM0_level2_quad_clean.evt |
| Size (bytes) | 2,224,753,920 | 388,287,360 |
| Size | 2.1 GB | 370.3 MB |
| Events in quadrant A | 6,600,999 | 2,535,612 |
| Events in quadrant B | 8,218,833 | 2,525,952 |
| Events in quadrant C | 31,064,077 | 2,227,240 |
| Events in quadrant D | 19,311,194 | 2,261,131 |
| Mode M9 | |||
|---|---|---|---|
| Quadrant | BADHDUFLAG | Total packets | Discarded packets |
| A | 0 | 21 | 0 |
| B | 0 | 21 | 0 |
| C | 0 | 21 | 0 |
| D | 0 | 21 | 0 |
| Mode SS | |||
|---|---|---|---|
| Quadrant | BADHDUFLAG | Total packets | Discarded packets |
| A | 0 | 654 | 0 |
| B | 0 | 654 | 0 |
| C | 0 | 654 | 0 |
| D | 0 | 654 | 0 |
| Mode M0 | |||
|---|---|---|---|
| Quadrant | BADHDUFLAG | Total packets | Discarded packets |
| A | 0 | 66205 | 0 |
| B | 0 | 72672 | 0 |
| C | 0 | 145368 | 0 |
| D | 0 | 111150 | 0 |
| Quadrant | Total seconds | Saturated seconds | Saturation percentage |
|---|---|---|---|
| A | 32113 | 251 | 0.781615% |
| B | 32113 | 555 | 1.728272% |
| C | 32113 | 6875 | 21.408775% |
| D | 32113 | 3070 | 9.559991% |
Noise dominated data is calculated using 1-second bins in cleaned event files. If a bin has >2000 counts, and if more than 50% of those come from <1% of pixels, then it is considered to be noise-dominated and hence unusable.
| Quadrant | # 1 sec bins | Bins with >0 counts | Bins with >2000 counts | High rate bins dominated by noise | Noise dominated (total time) | Noise dominated (detector-on time) | Marked lightcurve |
|---|---|---|---|---|---|---|---|
| A | 34238 | 32114 | 1 | 1 | 0.00% | 0.00% |  |
| B | 34238 | 32114 | 6 | 6 | 0.02% | 0.02% | 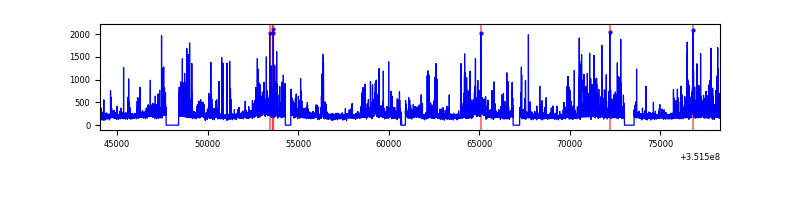 |
| C | 34238 | 32115 | 1232 | 1232 | 3.60% | 3.84% | 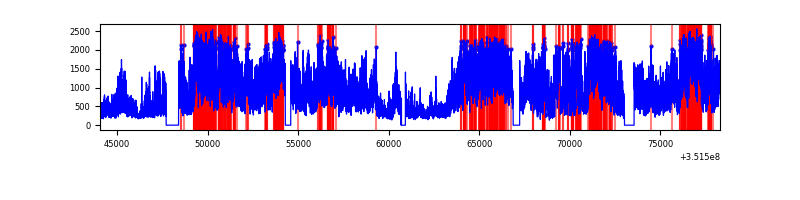 |
| D | 34238 | 32114 | 723 | 723 | 2.11% | 2.25% |  |
Top three noisy pixels from each quadrant. If the there are fewer than three noisy pixels in the level2.evt file, extra rows are filled as -1
| Pixel properties | Quadrant properties | ||||||
|---|---|---|---|---|---|---|---|
| Quadrant | DetID | PixID | Counts | Sigma | Mean | Median | Sigma |
| A | 15 | 169 | 82332 | 221.42 | 1673 | 1642 | 364.4 |
| A | 13 | 254 | 63412 | 169.5 | 1673 | 1642 | 364.4 |
| A | 0 | 13 | 40526 | 106.7 | 1673 | 1642 | 364.4 |
| B | 0 | 183 | 732413 | 2298.74 | 1675 | 1631 | 317.9 |
| B | 10 | 245 | 335993 | 1051.77 | 1675 | 1631 | 317.9 |
| B | 0 | 229 | 291992 | 913.36 | 1675 | 1631 | 317.9 |
| C | 3 | 233 | 25115355 | 69886.58 | 1521 | 1512 | 359.4 |
| C | 2 | 114 | 61578 | 167.15 | 1521 | 1512 | 359.4 |
| C | 8 | 128 | 20300 | 52.28 | 1521 | 1512 | 359.4 |
| D | 1 | 52 | 8529958 | 23033.37 | 1588 | 1535 | 370.3 |
| D | 8 | 195 | 3061844 | 8265.21 | 1588 | 1535 | 370.3 |
| D | 2 | 250 | 607287 | 1636.0 | 1588 | 1535 | 370.3 |
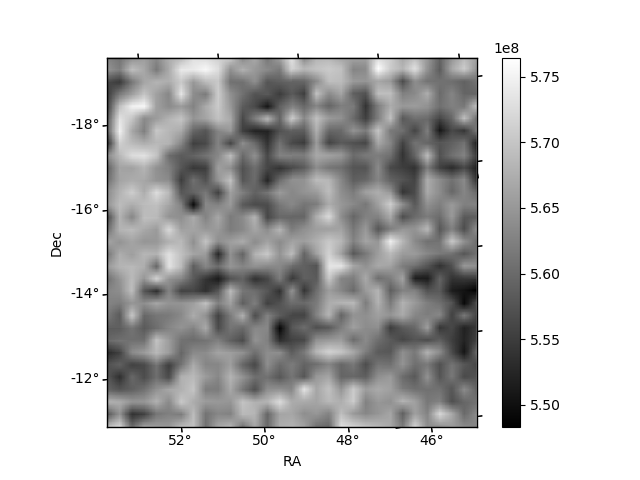
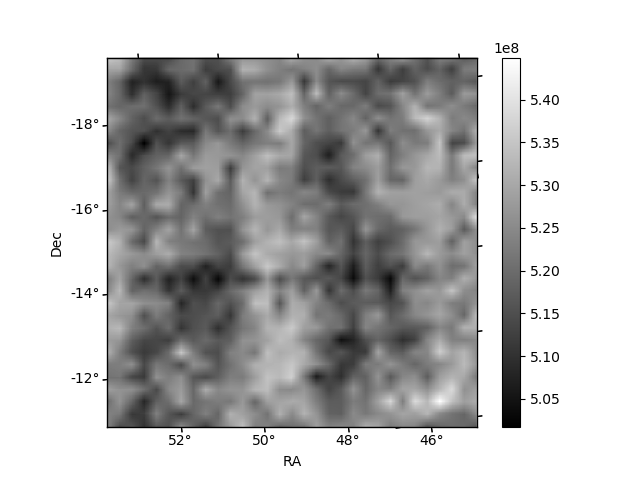
Histogram calculated using DETX and DETY for each event in the final _common_clean file
| Quadrant A |  |
 |
Quadrant B |
|---|---|---|---|
| Quadrant D | 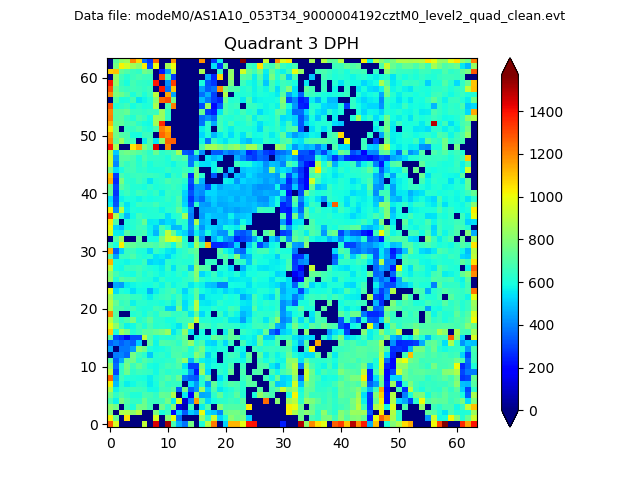 |
 |
Quadrant C |
| Plot type | Count rate plots | Images |
|---|---|---|
| Comparison with Poisson distribution Blue bars denote a histogram of data divided into 1 sec bins. Red curve is a Poisson curve with rate = median count rate of data. |
 |
 |
| Quadrant-wise count rates Data is divided into 100 sec bins |
 |
|
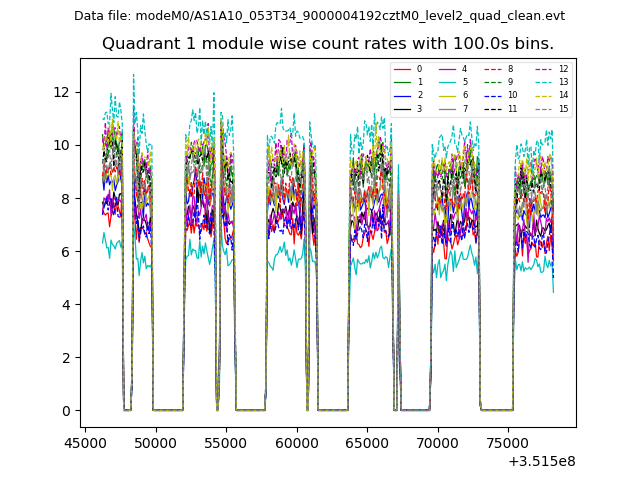
| Module-wise count rates for Quadrant A Data is divided into 100 sec bins |
 |
 |
| Module-wise count rates for Quadrant B Data is divided into 100 sec bins |
 |
 |
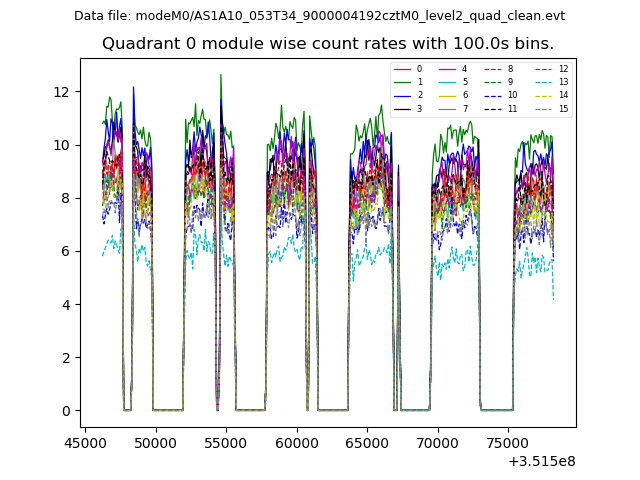
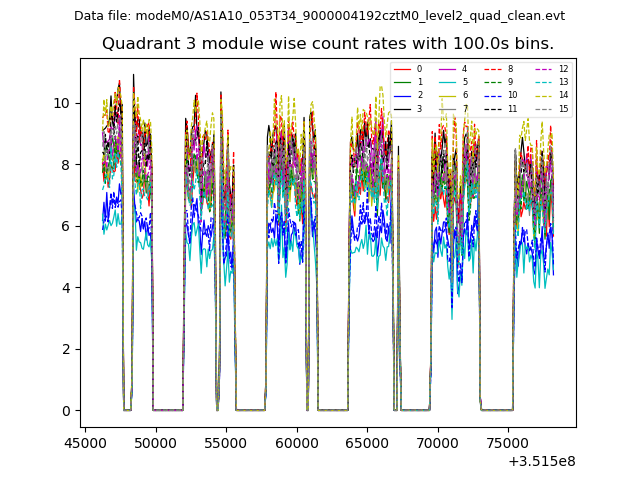
| Module-wise count rates for Quadrant C Data is divided into 100 sec bins |
 |
 |
| Module-wise count rates for Quadrant D Data is divided into 100 sec bins |
 |
 |
| Parameter | Plot |
|---|---|
| CZT HV Monitor |  |
| D_VDD |  |
| Temperature 1 |  |
| Veto HV Monitor |  |
| Veto LLD |  |
| Alpha Counter |  |
| _CPM_Rate | 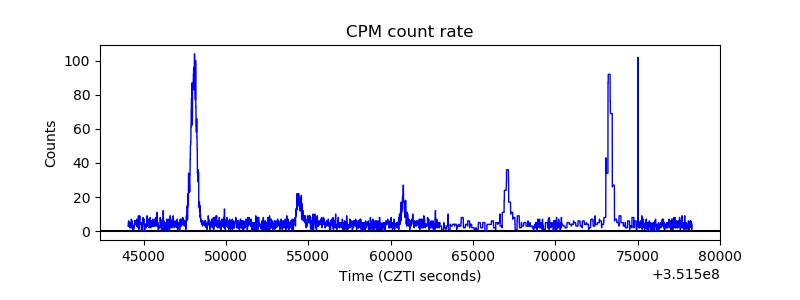 |
| CZT Counter |  |
| +2.5 Volts monitor |  |
| +5 Volts monitor | 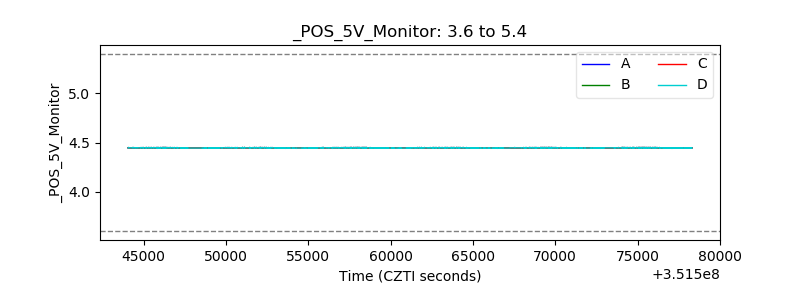 |
| _ROLL_ROT | 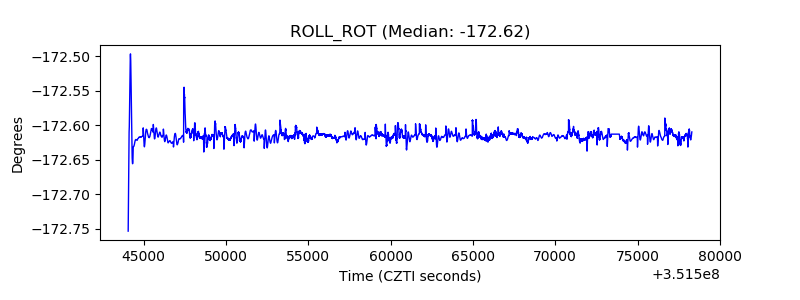 |
| _Roll_DEC |  |
| _Roll_RA |  |
| Veto Counter |  |