| Param | Original file | Final file |
|---|---|---|
| Filename | modeM0/AS1A10_053T19_9000004190cztM0_level2_bc.evt | modeM0/AS1A10_053T19_9000004190cztM0_level2_quad_clean.evt |
| Size (bytes) | 350,755,200 | 98,006,400 |
| Size | 334.5 MB | 93.5 MB |
| Events in quadrant A | 1,452,647 | 648,078 |
| Events in quadrant B | 2,028,122 | 650,168 |
| Events in quadrant C | 3,042,030 | 624,905 |
| Events in quadrant D | 3,648,572 | 588,850 |
| Mode SS | |||
|---|---|---|---|
| Quadrant | BADHDUFLAG | Total packets | Discarded packets |
| A | 0 | 134 | 0 |
| B | 0 | 134 | 0 |
| C | 0 | 134 | 0 |
| D | 0 | 134 | 0 |
| Mode M0 | |||
|---|---|---|---|
| Quadrant | BADHDUFLAG | Total packets | Discarded packets |
| A | 0 | 13753 | 0 |
| B | 0 | 15976 | 0 |
| C | 0 | 19468 | 0 |
| D | 0 | 21538 | 0 |
| Mode M9 | |||
|---|---|---|---|
| Quadrant | BADHDUFLAG | Total packets | Discarded packets |
| A | 0 | 22 | 0 |
| B | 0 | 22 | 0 |
| C | 0 | 22 | 0 |
| D | 0 | 22 | 0 |
| Quadrant | Total seconds | Saturated seconds | Saturation percentage |
|---|---|---|---|
| A | 6532 | 42 | 0.642988% |
| B | 6532 | 148 | 2.265769% |
| C | 6532 | 212 | 3.245560% |
| D | 6532 | 399 | 6.108389% |
Noise dominated data is calculated using 1-second bins in cleaned event files. If a bin has >2000 counts, and if more than 50% of those come from <1% of pixels, then it is considered to be noise-dominated and hence unusable.
| Quadrant | # 1 sec bins | Bins with >0 counts | Bins with >2000 counts | High rate bins dominated by noise | Noise dominated (total time) | Noise dominated (detector-on time) | Marked lightcurve |
|---|---|---|---|---|---|---|---|
| A | 7616 | 6532 | 0 | 0 | 0.00% | 0.00% |  |
| B | 7616 | 6531 | 9 | 9 | 0.12% | 0.14% |  |
| C | 7616 | 6531 | 0 | 0 | 0.00% | 0.00% |  |
| D | 7616 | 6531 | 102 | 102 | 1.34% | 1.56% |  |
Top three noisy pixels from each quadrant. If the there are fewer than three noisy pixels in the level2.evt file, extra rows are filled as -1
| Pixel properties | Quadrant properties | ||||||
|---|---|---|---|---|---|---|---|
| Quadrant | DetID | PixID | Counts | Sigma | Mean | Median | Sigma |
| A | 13 | 254 | 12670 | 148.87 | 376 | 368 | 82.6 |
| A | 0 | 226 | 2356 | 24.06 | 376 | 368 | 82.6 |
| A | 12 | 194 | 2241 | 22.67 | 376 | 368 | 82.6 |
| B | 5 | 255 | 220681 | 3021.57 | 377 | 370 | 72.9 |
| B | 0 | 183 | 194512 | 2662.66 | 377 | 370 | 72.9 |
| B | 0 | 229 | 72152 | 984.49 | 377 | 370 | 72.9 |
| C | 3 | 233 | 1635835 | 18862.11 | 362 | 361 | 86.7 |
| C | 2 | 114 | 13481 | 151.31 | 362 | 361 | 86.7 |
| C | 13 | 61 | 2195 | 21.15 | 362 | 361 | 86.7 |
| D | 1 | 52 | 1466006 | 17542.52 | 359 | 348 | 83.5 |
| D | 8 | 195 | 480603 | 5748.19 | 359 | 348 | 83.5 |
| D | 2 | 250 | 103333 | 1232.63 | 359 | 348 | 83.5 |
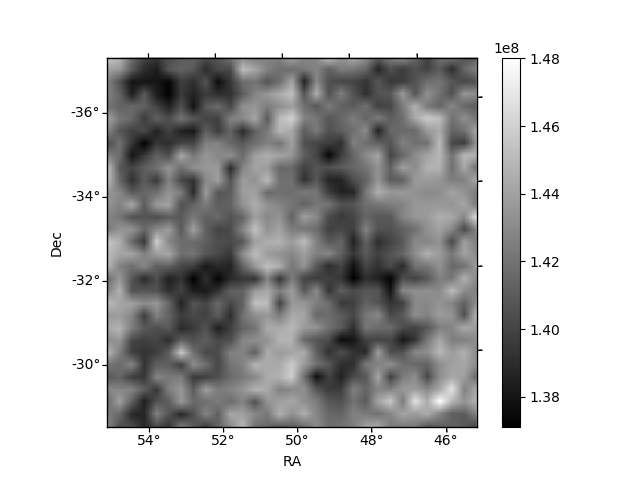
Histogram calculated using DETX and DETY for each event in the final _common_clean file
| Quadrant A |  |
 |
Quadrant B |
|---|---|---|---|
| Quadrant D | 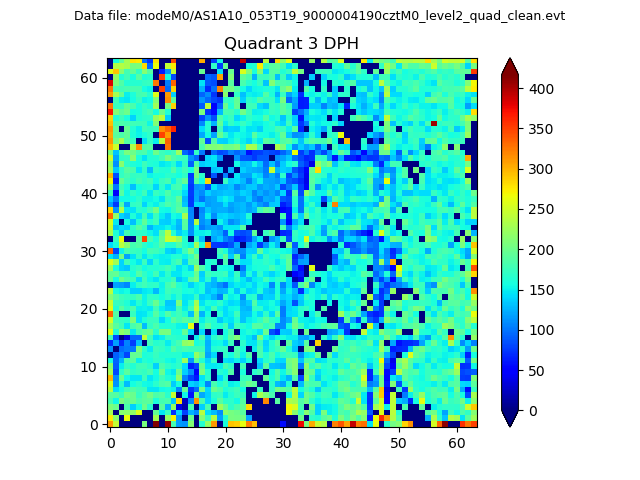 |
 |
Quadrant C |
| Plot type | Count rate plots | Images |
|---|---|---|
| Comparison with Poisson distribution Blue bars denote a histogram of data divided into 1 sec bins. Red curve is a Poisson curve with rate = median count rate of data. |
 |
 |
| Quadrant-wise count rates Data is divided into 100 sec bins |
 |
|
| Module-wise count rates for Quadrant A Data is divided into 100 sec bins |
 |
 |
| Module-wise count rates for Quadrant B Data is divided into 100 sec bins |
 |
 |
| Module-wise count rates for Quadrant C Data is divided into 100 sec bins |
 |
 |
| Module-wise count rates for Quadrant D Data is divided into 100 sec bins |
 |
 |
| Parameter | Plot |
|---|---|
| CZT HV Monitor | 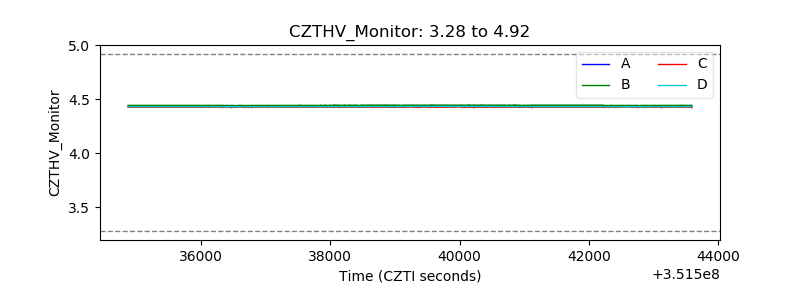 |
| D_VDD |  |
| Temperature 1 |  |
| Veto HV Monitor | 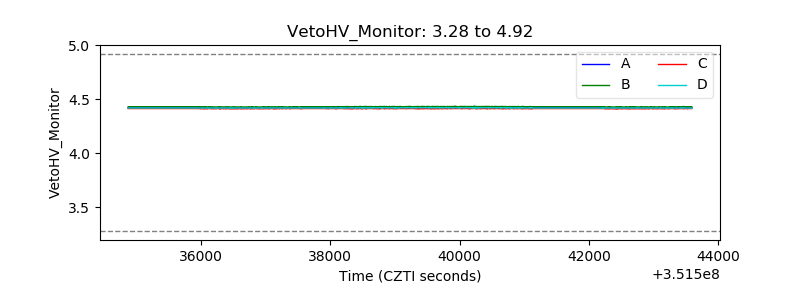 |
| Veto LLD | 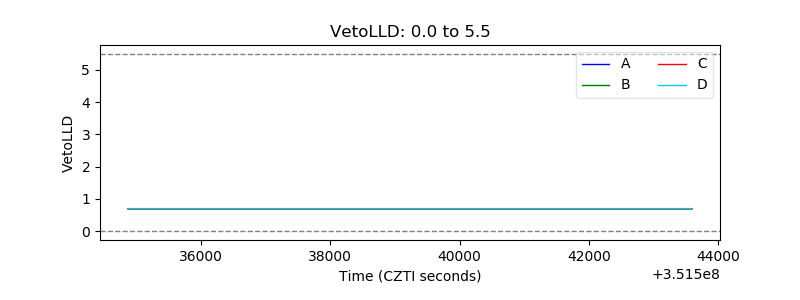 |
| Alpha Counter |  |
| _CPM_Rate |  |
| CZT Counter |  |
| +2.5 Volts monitor |  |
| +5 Volts monitor |  |
| _ROLL_ROT |  |
| _Roll_DEC |  |
| _Roll_RA |  |
| Veto Counter | 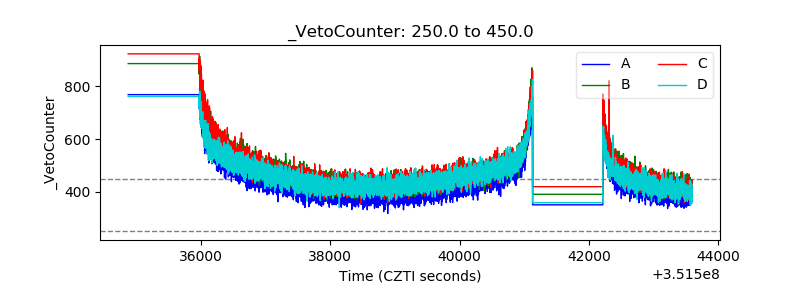 |