| Param | Original file | Final file |
|---|---|---|
| Filename | modeM0/AS1A10_021T08_9000004186cztM0_level2_bc.evt | modeM0/AS1A10_021T08_9000004186cztM0_level2_quad_clean.evt |
| Size (bytes) | 485,599,680 | 172,255,680 |
| Size | 463.1 MB | 164.3 MB |
| Events in quadrant A | 2,935,532 | 1,115,797 |
| Events in quadrant B | 3,194,669 | 1,138,750 |
| Events in quadrant C | 3,135,558 | 1,098,015 |
| Events in quadrant D | 4,654,306 | 1,072,168 |
| Mode M9 | |||
|---|---|---|---|
| Quadrant | BADHDUFLAG | Total packets | Discarded packets |
| A | 0 | 37 | 0 |
| B | 0 | 38 | 0 |
| C | 0 | 38 | 0 |
| D | 0 | 38 | 0 |
| Mode SS | |||
|---|---|---|---|
| Quadrant | BADHDUFLAG | Total packets | Discarded packets |
| A | 0 | 232 | 0 |
| B | 0 | 232 | 0 |
| C | 0 | 232 | 0 |
| D | 0 | 232 | 0 |
| Mode M0 | |||
|---|---|---|---|
| Quadrant | BADHDUFLAG | Total packets | Discarded packets |
| A | 0 | 26167 | 0 |
| B | 0 | 27355 | 0 |
| C | 0 | 27646 | 0 |
| D | 0 | 32252 | 0 |
| Quadrant | Total seconds | Saturated seconds | Saturation percentage |
|---|---|---|---|
| A | 11457 | 162 | 1.413983% |
| B | 11457 | 225 | 1.963865% |
| C | 11457 | 298 | 2.601030% |
| D | 11457 | 416 | 3.630968% |
Noise dominated data is calculated using 1-second bins in cleaned event files. If a bin has >2000 counts, and if more than 50% of those come from <1% of pixels, then it is considered to be noise-dominated and hence unusable.
| Quadrant | # 1 sec bins | Bins with >0 counts | Bins with >2000 counts | High rate bins dominated by noise | Noise dominated (total time) | Noise dominated (detector-on time) | Marked lightcurve |
|---|---|---|---|---|---|---|---|
| A | 14151 | 11457 | 0 | 0 | 0.00% | 0.00% |  |
| B | 14151 | 11457 | 0 | 0 | 0.00% | 0.00% | 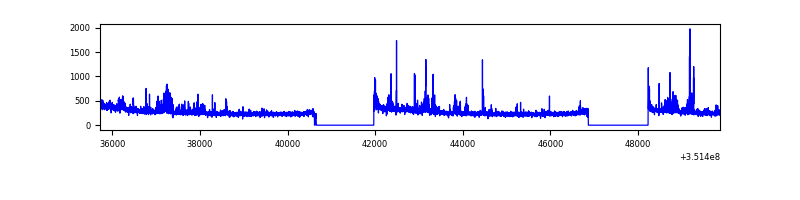 |
| C | 14151 | 11457 | 0 | 0 | 0.00% | 0.00% |  |
| D | 14151 | 11458 | 21 | 21 | 0.15% | 0.18% |  |
Top three noisy pixels from each quadrant. If the there are fewer than three noisy pixels in the level2.evt file, extra rows are filled as -1
| Pixel properties | Quadrant properties | ||||||
|---|---|---|---|---|---|---|---|
| Quadrant | DetID | PixID | Counts | Sigma | Mean | Median | Sigma |
| A | 13 | 254 | 21097 | 128.63 | 759 | 750 | 158.2 |
| A | 0 | 226 | 4838 | 25.84 | 759 | 750 | 158.2 |
| A | 12 | 194 | 4542 | 23.97 | 759 | 750 | 158.2 |
| B | 0 | 183 | 178664 | 1276.09 | 770 | 758 | 139.4 |
| B | 5 | 255 | 39021 | 274.45 | 770 | 758 | 139.4 |
| B | 0 | 190 | 13475 | 91.22 | 770 | 758 | 139.4 |
| C | 3 | 233 | 256717 | 1501.32 | 744 | 746 | 170.5 |
| C | 2 | 114 | 22365 | 126.8 | 744 | 746 | 170.5 |
| C | 13 | 61 | 4268 | 20.66 | 744 | 746 | 170.5 |
| D | 8 | 195 | 809243 | 4908.59 | 746 | 728 | 164.7 |
| D | 1 | 52 | 682214 | 4137.38 | 746 | 728 | 164.7 |
| D | 13 | 153 | 86029 | 517.87 | 746 | 728 | 164.7 |
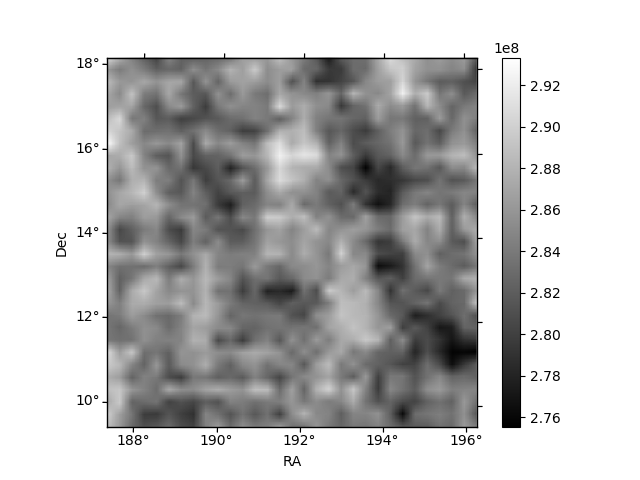
Histogram calculated using DETX and DETY for each event in the final _common_clean file
| Quadrant A |  |
 |
Quadrant B |
|---|---|---|---|
| Quadrant D |  |
 |
Quadrant C |
| Plot type | Count rate plots | Images |
|---|---|---|
| Comparison with Poisson distribution Blue bars denote a histogram of data divided into 1 sec bins. Red curve is a Poisson curve with rate = median count rate of data. |
 |
 |
| Quadrant-wise count rates Data is divided into 100 sec bins |
 |
|
| Module-wise count rates for Quadrant A Data is divided into 100 sec bins |
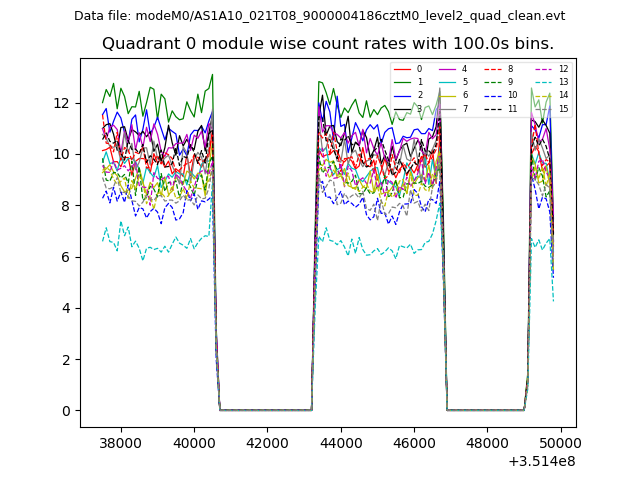 |
 |
| Module-wise count rates for Quadrant B Data is divided into 100 sec bins |
 |
 |
| Module-wise count rates for Quadrant C Data is divided into 100 sec bins |
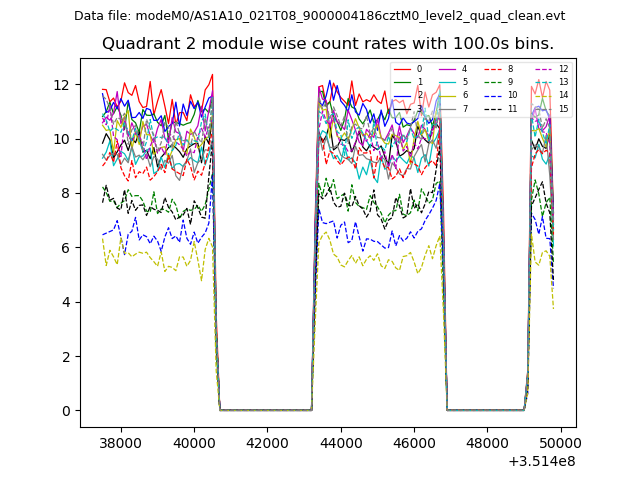 |
 |
| Module-wise count rates for Quadrant D Data is divided into 100 sec bins |
 |
 |
| Parameter | Plot |
|---|---|
| CZT HV Monitor |  |
| D_VDD |  |
| Temperature 1 |  |
| Veto HV Monitor |  |
| Veto LLD | 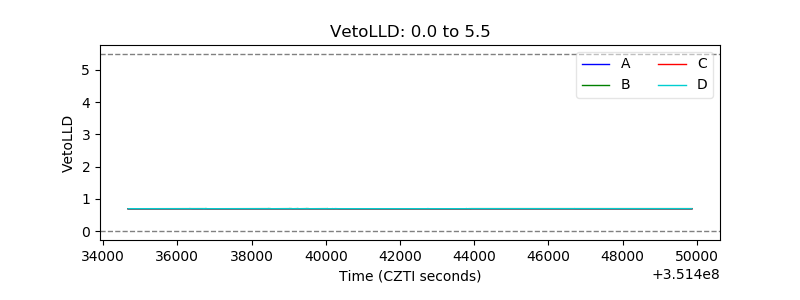 |
| Alpha Counter |  |
| _CPM_Rate |  |
| CZT Counter | 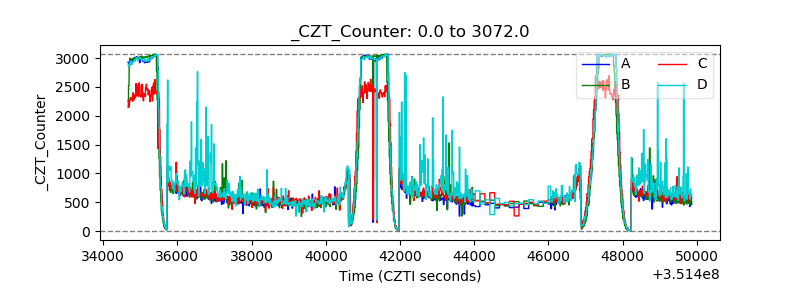 |
| +2.5 Volts monitor |  |
| +5 Volts monitor |  |
| _ROLL_ROT |  |
| _Roll_DEC |  |
| _Roll_RA | 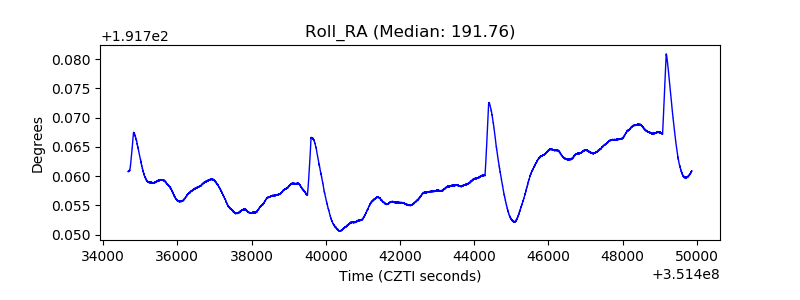 |
| Veto Counter |  |