| Param | Original file | Final file |
|---|---|---|
| Filename | modeM0/AS1A10_099T01_9000004184cztM0_level2_bc.evt | modeM0/AS1A10_099T01_9000004184cztM0_level2_quad_clean.evt |
| Size (bytes) | 11,139,920,640 | 3,904,295,040 |
| Size | 10.4 GB | 3.6 GB |
| Events in quadrant A | 64,111,763 | 25,039,799 |
| Events in quadrant B | 69,145,378 | 25,498,713 |
| Events in quadrant C | 64,455,416 | 24,264,565 |
| Events in quadrant D | 119,686,597 | 23,351,862 |
| Mode M9 | |||
|---|---|---|---|
| Quadrant | BADHDUFLAG | Total packets | Discarded packets |
| A | 0 | 472 | 0 |
| B | 0 | 472 | 0 |
| C | 0 | 472 | 0 |
| D | 0 | 472 | 0 |
| Mode SS | |||
|---|---|---|---|
| Quadrant | BADHDUFLAG | Total packets | Discarded packets |
| A | 0 | 5986 | 0 |
| B | 0 | 5986 | 0 |
| C | 0 | 5986 | 0 |
| D | 0 | 5986 | 0 |
| Mode M0 | |||
|---|---|---|---|
| Quadrant | BADHDUFLAG | Total packets | Discarded packets |
| A | 0 | 620560 | 0 |
| B | 0 | 638987 | 0 |
| C | 0 | 627894 | 0 |
| D | 0 | 811357 | 0 |
| Quadrant | Total seconds | Saturated seconds | Saturation percentage |
|---|---|---|---|
| A | 293608 | 3301 | 1.124288% |
| B | 293609 | 4658 | 1.586464% |
| C | 293609 | 5428 | 1.848717% |
| D | 293609 | 12843 | 4.374185% |
Noise dominated data is calculated using 1-second bins in cleaned event files. If a bin has >2000 counts, and if more than 50% of those come from <1% of pixels, then it is considered to be noise-dominated and hence unusable.
| Quadrant | # 1 sec bins | Bins with >0 counts | Bins with >2000 counts | High rate bins dominated by noise | Noise dominated (total time) | Noise dominated (detector-on time) | Marked lightcurve |
|---|---|---|---|---|---|---|---|
| A | 344289 | 293623 | 1 | 1 | 0.00% | 0.00% |  |
| B | 344289 | 293620 | 28 | 28 | 0.01% | 0.01% |  |
| C | 344289 | 293620 | 0 | 0 | 0.00% | 0.00% | 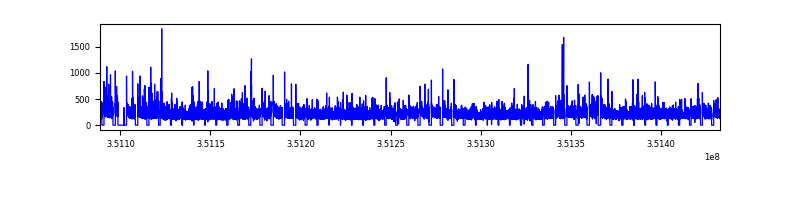 |
| D | 344289 | 293615 | 1881 | 1881 | 0.55% | 0.64% | 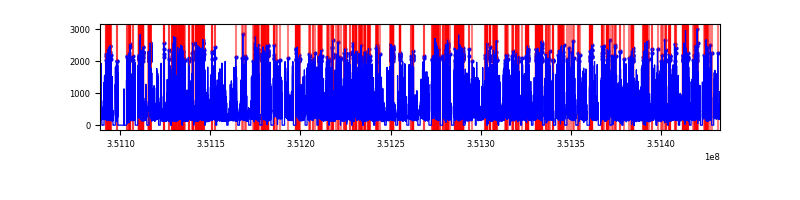 |
Top three noisy pixels from each quadrant. If the there are fewer than three noisy pixels in the level2.evt file, extra rows are filled as -1
| Pixel properties | Quadrant properties | ||||||
|---|---|---|---|---|---|---|---|
| Quadrant | DetID | PixID | Counts | Sigma | Mean | Median | Sigma |
| A | 13 | 254 | 493279 | 135.79 | 16496 | 16246 | 3512.9 |
| A | 15 | 174 | 292186 | 78.55 | 16496 | 16246 | 3512.9 |
| A | 0 | 226 | 104312 | 25.07 | 16496 | 16246 | 3512.9 |
| B | 0 | 183 | 1571545 | 506.1 | 16625 | 16266 | 3073.1 |
| B | 10 | 246 | 1441063 | 463.64 | 16625 | 16266 | 3073.1 |
| B | 10 | 245 | 877286 | 280.18 | 16625 | 16266 | 3073.1 |
| C | 3 | 233 | 2696579 | 727.09 | 15848 | 15841 | 3687.0 |
| C | 2 | 114 | 561597 | 148.02 | 15848 | 15841 | 3687.0 |
| C | 14 | 241 | 94659 | 21.38 | 15848 | 15841 | 3687.0 |
| D | 1 | 52 | 37190192 | 10405.41 | 15868 | 15370 | 3572.6 |
| D | 8 | 195 | 17392142 | 4863.84 | 15868 | 15370 | 3572.6 |
| D | 2 | 234 | 1201635 | 332.04 | 15868 | 15370 | 3572.6 |
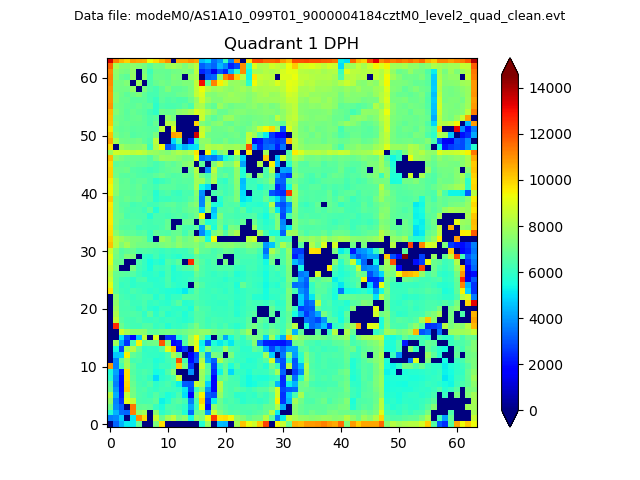
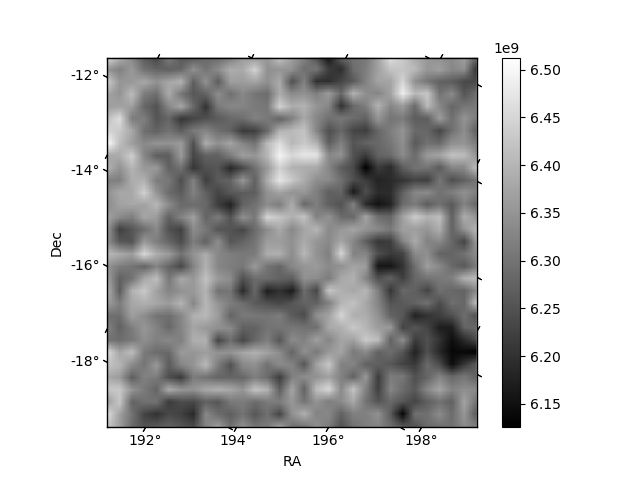
Histogram calculated using DETX and DETY for each event in the final _common_clean file
| Quadrant A |  |
 |
Quadrant B |
|---|---|---|---|
| Quadrant D | 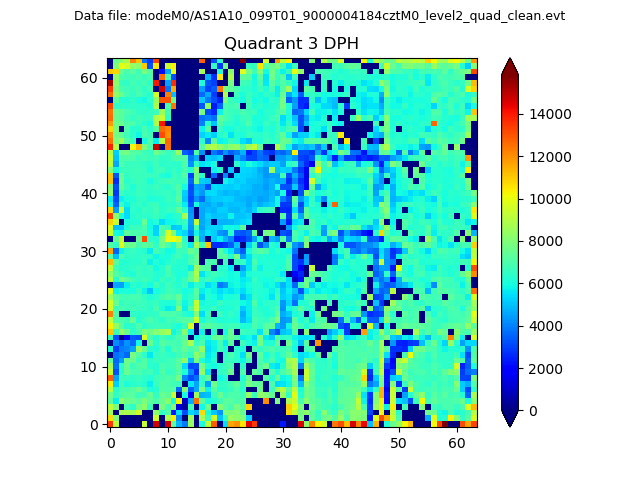 |
 |
Quadrant C |
| Plot type | Count rate plots | Images |
|---|---|---|
| Comparison with Poisson distribution Blue bars denote a histogram of data divided into 1 sec bins. Red curve is a Poisson curve with rate = median count rate of data. |
 |
 |
| Quadrant-wise count rates Data is divided into 100 sec bins |
 |
|
| Module-wise count rates for Quadrant A Data is divided into 100 sec bins |
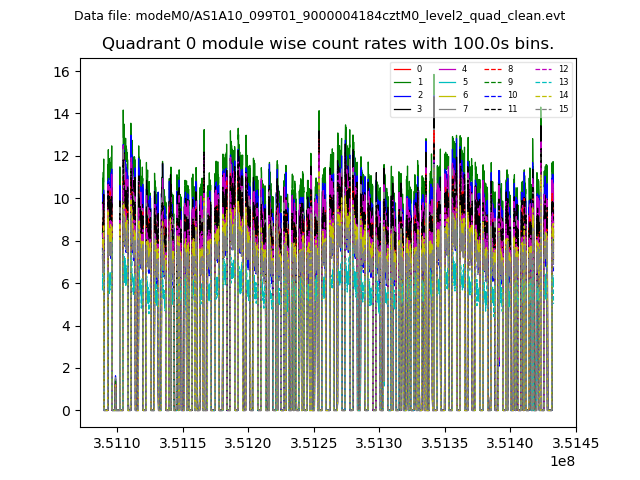 |
 |
| Module-wise count rates for Quadrant B Data is divided into 100 sec bins |
 |
 |
| Module-wise count rates for Quadrant C Data is divided into 100 sec bins |
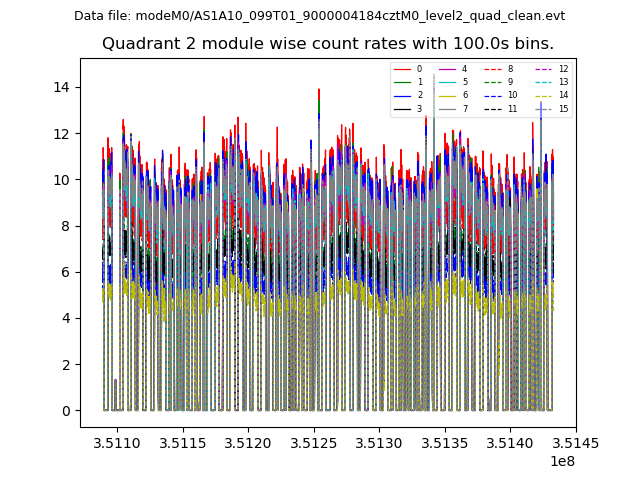 |
 |
| Module-wise count rates for Quadrant D Data is divided into 100 sec bins |
 |
 |
| Parameter | Plot |
|---|---|
| CZT HV Monitor |  |
| D_VDD |  |
| Temperature 1 |  |
| Veto HV Monitor |  |
| Veto LLD | 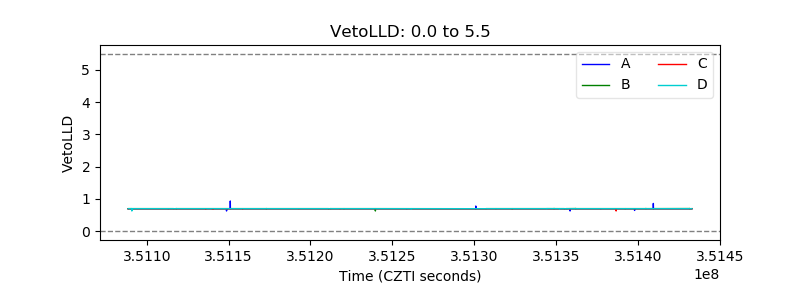 |
| Alpha Counter |  |
| _CPM_Rate |  |
| CZT Counter | 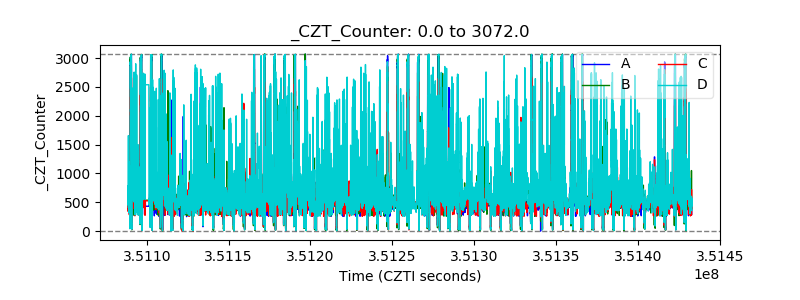 |
| +2.5 Volts monitor |  |
| +5 Volts monitor |  |
| _ROLL_ROT |  |
| _Roll_DEC |  |
| _Roll_RA |  |
| Veto Counter |  |